Custom PowerPoints Using {officer}

From a purely design perspective, Quarto’s standard PowerPoint output
falls short. It is limited to
seven layout
options, with the most complex being “Two Content.” The {officer} R
package offers a powerful alternative for those seeking full control and
customisation.
Why PowerPoint?
At work, I use a Linux operating system (OS), and at home, I use macOS. Within my little bubble, it’s easy to forget how much of the market share Microsoft still holds. It’s estimated that around 70% of the desktop operating system market share belongs to Microsoft. Many of the clients I work with prefer Microsoft outputs, such as PowerPoint, over HTML or PDF. Aside from company alignment with Microsoft, there are a few practical reasons why using PowerPoint with Quarto can be advantageous:
- No need to be a CSS / LaTeX whizz-kid to produce professional-looking slides
- Possible (and easy) to edit after rendering the doc!
What is {officer}?
From davidgohel.github.io/officer
The officer package lets R users manipulate Word (.docx) and PowerPoint (*.pptx) documents. In short, one can add images, tables and text into documents from R. An initial document can be provided; contents, styles and properties of the original document will then be available.
This means for this workflow, Quarto is sidestepped altogether, and we focus entirely on R scripts and R coding.
How?
There are a few ways to use {officer} - I’ll walk through the approach that I’ve found to be most effective.
Layout templates
First - you’ll need a PowerPoint presentation that contains template layout slides. There are no limits to these slides, the format can be as custom as you like and there can be as many layouts as you want. Remember - this file doesn’t need any actual slides, it only needs layouts! To create a layout:
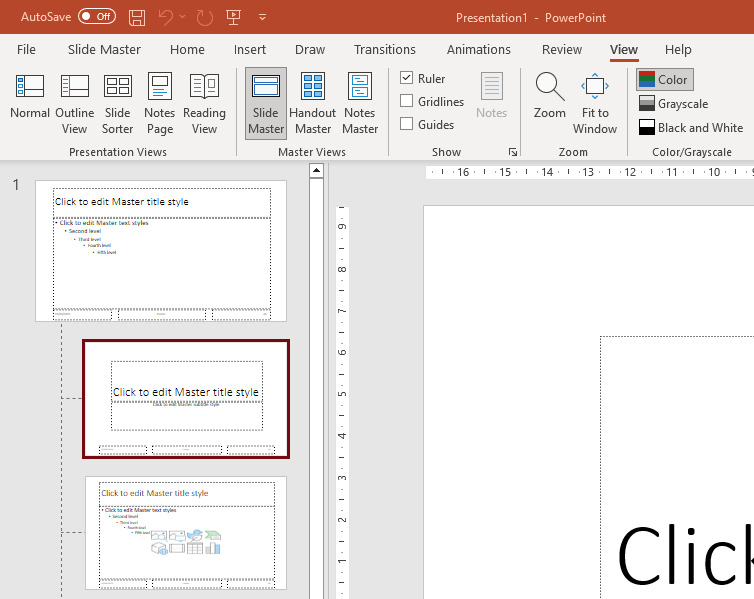
- Enter “Slide Master” mode
- Add any content (headers, footers, styling etc) you want to appear on each slide to the “Slide Master”
- Create a new Layout Slide
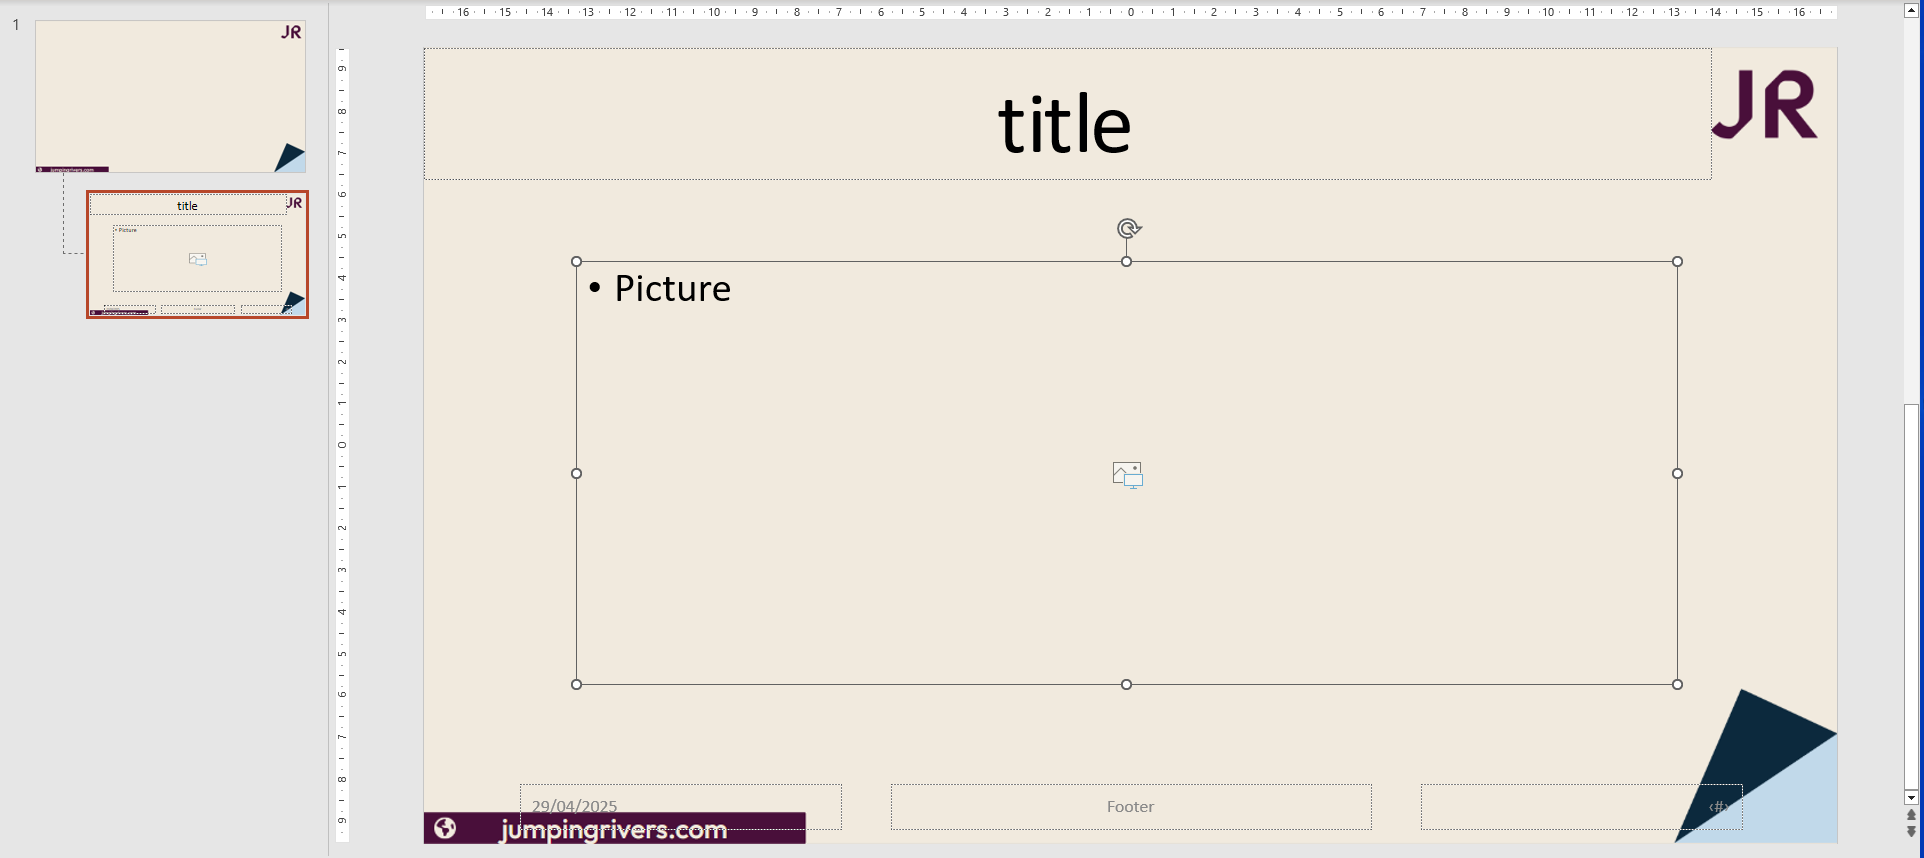
To insert content from R, the easiest way is via placeholders. These can be text, tables, images and more. To add a placeholder:
- Click “Insert Placeholder” and choose the content type
- If it’s a text placeholder, you can customise the formatting of the text
You can see below that I’ve added some basic Jumping River styling to mine, and added two placeholders; a text placeholder for a title and an image placeholder for a plot.
In order to access these placeholders easily from R, it’s better to rename them:
- Home tab
- Click the “Select” dropdown
- Click “Selection pane”
- Select your placeholder and rename
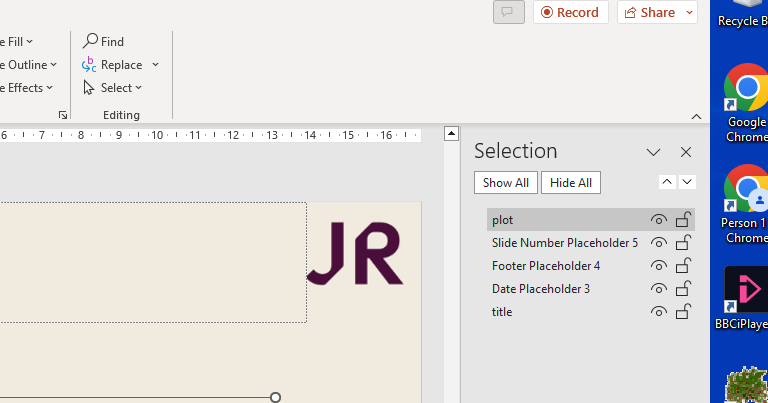
Here I’ve named my image placeholder “plot”, and my text placeholder for the slide title, “title”. Note that it’s also a good idea to name your layout - just right click and hit rename. In this demo I’ve just left it as “Title Slide”.
The R code
Now that I’ve got my template set up, the rest is in R. First, we load {officer} and read the PowerPoint document in as an R object.
library("officer")
doc = read_pptx("mytemplate.pptx")
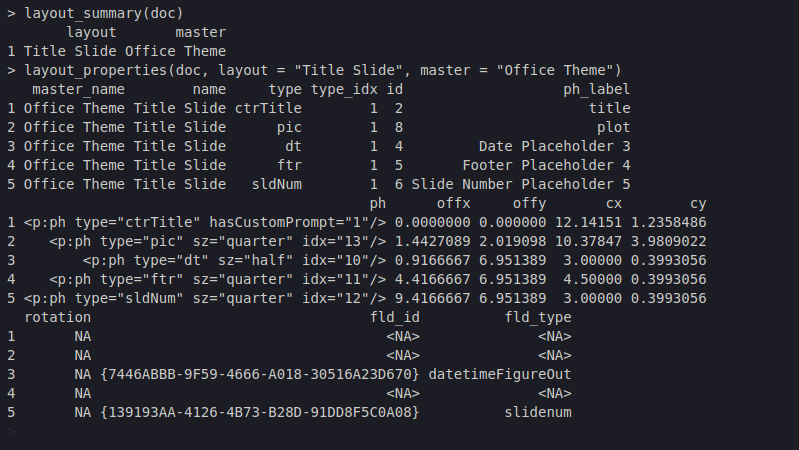
If you’ve forgotten your layout / placeholder names, access them through
layout_summary() and layout_properties()
layout_summary(doc)
layout_properties(doc, layout = "Title Slide", master = "Office Theme")
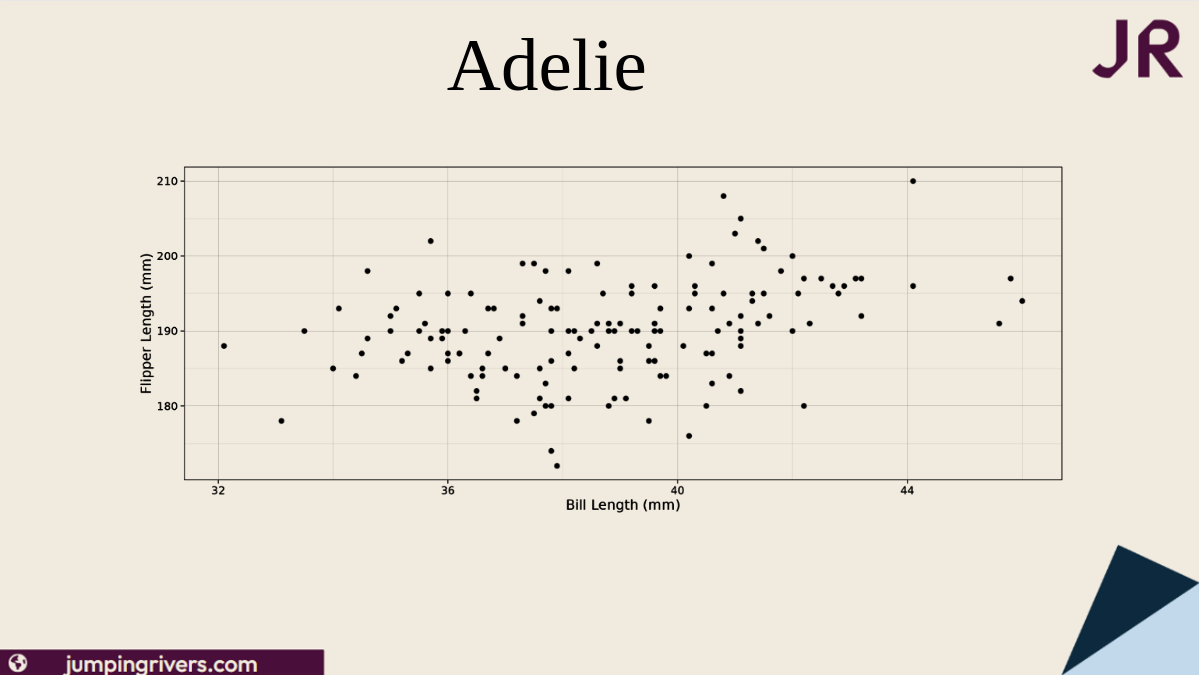
Before any content can be added, content is needed! Let’s use the {palmerpenguins} package to create a simple plot of “Adelie” penguins data
library("palmerpenguins")
library("dplyr")
library("ggplot2")

adelie_plot = penguins |>
  filter(species == "Adelie") |>
  ggplot(aes(x = bill_length_mm, y = flipper_length_mm)) +
  geom_point() +
  theme_linedraw() +
  theme(
    # Make the background transparent
    plot.background = element_rect(fill = "transparent", colour = NA),
    # Match the panel colour to the slide
    panel.background = element_rect(fill = "#F1EADE", colour = NA)) +
  labs(
    x = "Bill Length (mm)",
    y = "Flipper Length (mm)")
I can add empty slides to the document using the add_slide() function.
Here I simply choose a layout from my .pptx file to use.
doc = add_slide(doc, layout = "Jumping Rivers", master = "Office Theme")
doc
Then, using the ph_with() function, I can insert R objects into my placeholders by name
doc = ph_with(
  doc,
  value = "Adelie",
  location = ph_location_label("title")
)
# Add the plot
doc = ph_with(
  doc,
  value = adelie_plot,
  location = ph_location_label("myplot")
)
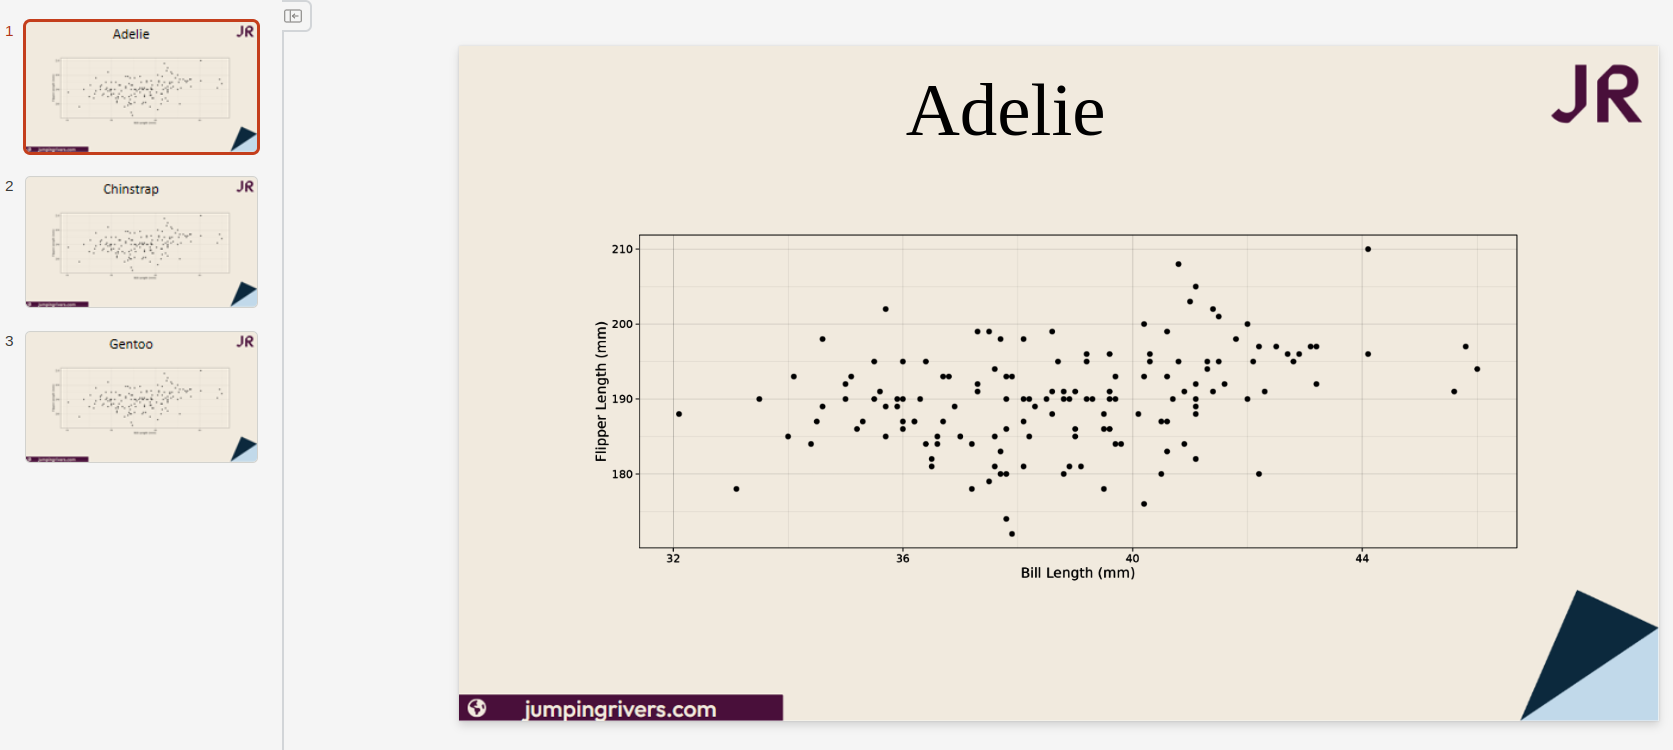
To create the PowerPoint, use print()
print(doc, "penguins.pptx")
And there we have it! I’ve used only two placeholders here to keep the example simple, but in reality there is no limit.
Looping
It’s easy to make use of programming when using purely R code to generate PowerPoints. For instance, we could stick our code into a for loop, and add a slide for each Penguin species
# Read in doc again
# this resets the doc object to the original file
doc = read_pptx("mytemplate.pptx")

for (penguin_species in c("Adelie", "Chinstrap", "Gentoo")) {
  doc = add_slide(doc, layout = "Title Slide", master = "Office Theme")
  # Add the title using the iterator value
  doc = ph_with(
    doc,
    value = penguin_species,
    location = ph_location_label("title")
  )
  # Create the plot using the iterator value
  penguin_plot = penguins |>
    filter(species == penguin_species) |>
    ggplot(aes(x = bill_length_mm, y = flipper_length_mm)) +
    geom_point() +
    theme_linedraw()
    theme(
      plot.background = element_rect(fill = "transparent", colour = NA),
      panel.background = element_rect(fill = "#F1EADE", colour = NA)) +
    labs(
      x = "Bill Length (mm)",
      y = "Flipper Length (mm)")
  # Add the plot
  doc = ph_with(
    doc,
    value = adelie_plot,
    location = ph_location_label("plot")
  )
}
# Output to a file
print(doc, "penguins_loop.pptx")
Conclusion
There are a few drawbacks to this method:
- It is quite annoying to insert large amounts of text using just an R script
- Content added to the “Slide Master” slide cannot be moved or edited on the output file
- The web version of powerpoint doesn’t have the Slide Master functionality features
However, I think the pros outweigh the cons:
- Completely (and I mean completely) custom layouts
- I haven’t covered this here but it’s really easy to convert ggplots to vector graphics in DrawingML format so they can be edited in PowerPoint
- Easier to programmatically generate lots of slides
- It can be edited after rendering by anyone!
- It can be styled before rendering by anyone!