Why should I use R: Handling Dates in R and Excel: Part 3

This is part 3 of an ongoing series on why you should use R. Future blogs will be linked here as they are released.
- Part 1: Why should I use R: The Excel R Data Wrangling comparison: Part 1
- Part 2: Why should I use R: The Excel R plotting comparison: Part 2
- Part 3: Why should I use R: Handling Dates in R and Excel: Part 3 (This post)
Dates in Excel
Here we will explore the various ways to handle dates in Excel and R. Dates are a crucial part of data analysis and are used in various fields such as biology, healthcare, and social sciences. However, working with dates can be challenging, especially when dealing with large datasets or multiple formats.
In Excel, there are several functions available to handle dates, such as
DATE, YEAR, MONTH, and DAY. Excel also provides various
formatting options to customise the display of dates. However, Excel has
some limitations when it comes to complex date calculations, and it can
be time-consuming to work with dates in large datasets.
In contrast, R has a robust set of tools for handling dates, including the {lubridate} package, which simplifies the manipulation of dates and times. Additionally, R allows for efficient handling of dates in large datasets, making it a powerful tool for time-series analysis. Whether you are working with dates in Excel or R, this blog will provide you with the basic tools and techniques to handle dates efficiently and accurately. So let’s get started!
Handling dates using {lubridate}
The {lubridate} package provides a range of functions that simplify common tasks. {lubridate} makes working with dates and times more intuitive and less error-prone, allowing users to focus on their analysis rather than the difficulties of date manipulation.
The {lubridate} package provides:
User-friendly syntax: consistent and intuitive syntax which makes it easier to understand and write code for date operations.
Comprehensive functionality: Offers a range of built in functions for common date operations. It allows us to parse dates from different formats and extract information such as year, month and day. This functionality saves time and effort compared to your manual calculations in Excel.
Date representation: {lubridate} ensures consistent date representation by using the POSIXct class, which stores dates as numbers of seconds since 1 January 1970.
Converting dates:
In Excel, to convert a string into a date format, you can use the
DATEVALUE() function. For example, if your date is in cell A2, you
can use =DATEVALUE(A2) to convert it into a date format. In R, you can
use the as_date() function to convert a string into a date format. For
example, if your date is "2023-01-18", you can use
as_date("2023-01-18").
R
In R, when running the class function on as_date("2023-01-18"), it
returns the class or data type of the object. In this case, it would
return “Date” since as-date("2023-01-18") converts the given string
into a date object.
class(2023-05-16)
## [1] "numeric"
lubridate::as_date("2023-01-18")
## [1] "2023-01-18"
class(lubridate::as_date("2023-01-18"))
## [1] "Date"
Calculating time intervals:
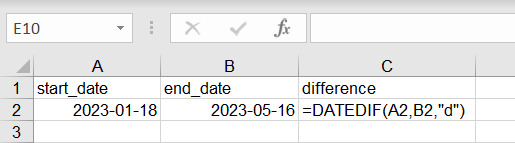
In Excel, you can use the DATEDIF() function to calculate the time
difference between two dates in various units (years, months, etc.). For
example, if you want to calculate the number of days between two dates
in cells A2 and B2, you can use = DATEDIF(A2,B2,"d"). In R, using
{lubridate}, you can calculate the difference in dates using the
interval() function. Let’s calculate the difference between the two
dates specified (January 18, 2023 and May 16, 2023) in terms of days.
Excel
The screenshot shows how you would use = DATEDIF() in a cell to
calculate the interval between two dates.
R
The following code performs the same action in R, taking the start date
and end date and calculating the difference. We then convert the
difference to days using as.numeric().
library("lubridate")
##
## Attaching package: 'lubridate'
## The following objects are masked from 'package:base':
##
##     date, intersect, setdiff, union

start_date = as_date("2023-01-18")
end_date = as_date("2023-05-16")

diff_date = interval(start_date, end_date) |>
  as.duration() |>
  as.numeric(unit = "days")

diff_date
## [1] 118
Formatting dates:
Dates in Excel can be formatted using the Format Cells feature. For
example, you can format a date as dd-mmm-yyyy to display it as
"16-May-2023". In R, you can use the format() function to format a
date in various ways.
Excel
The following gif shows the manual process of formatting a date in Excel using the Format>Format cells process.

R
The following lines of code accomplish the same thing.
date = lubridate::as_date("2023-05-16")
date_formatted = format(date, "%d-%b-%Y")
date_formatted
## [1] "16-Mai-2023"
Overall, Excel and R have different syntax and functions for handling dates, but both can be used effectively for data analysis and manipulation. It’s important to choose the tool that is best suited for your specific needs and workflow.
Extracting components of a date:
In R, you can extract different components of a date, such as the year, month, or day, using various functions. For example:
my_date = lubridate::as_date("2023-05-16")
year(my_date)
## [1] 2023
month(my_date)
## [1] 5
day(my_date)
## [1] 16
In Excel, you can extract different components of a date using the
YEAR(), MONTH(), and DAY() functions.
The Movies Data
Let’s dive into more advanced examples of working with dates in R and
Excel. In our previous
blog
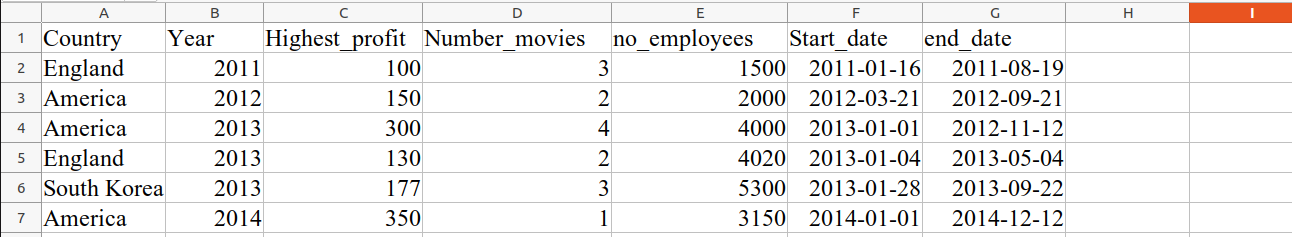
series comparing Excel and R, we utilised a dataset called “movies data”
which consists of five columns: country, year, highest movie profit,
number of movies produced, and number of employees involved in the
production. We’ve added two new columns to our dataset called
start_date and end_date.
library(readr)
movies_data = read_csv("blog-data.csv")
## Rows: 6 Columns: 7
## ── Column specification ────────────────────────────────────────────────────────
## Delimiter: ","
## chr  (1): Country
## dbl  (4): Year, Highest_profit, Number_movies, no_employees
## date (2): start_date, end_date
##
## ℹ Use `spec()` to retrieve the full column specification for this data.
## ℹ Specify the column types or set `show_col_types = FALSE` to quiet this message.
head(movies_data)
## # A tibble: 6 × 7
##   Country   Year Highest_profit Number_movies no_employees start_date end_date
##   <chr>    <dbl>          <dbl>         <dbl>        <dbl> <date>     <date>
## 1 England   2011            100             3         1500 2011-01-16 2011-08-19
## 2 America   2012            150             2         2000 2012-03-21 2012-09-21
## 3 America   2013            300             4         4000 2013-01-01 2012-11-12
## 4 England   2013            130             2         4020 2013-01-04 2013-05-04
## 5 South K…  2013            177             3         5300 2013-01-28 2013-09-22
## 6 America   2014            350             1         3150 2014-01-01 2014-12-12
Let’s say we wanted to calculate the duration in days for each movie production, and then find the average duration per country.
R
In R, we can accomplish this by using the {lubridate} and {dplyr} packages. The first portion of this code takes the start and end dates of the movie production as dates, and then calculates the time between the dates, converting it to a numeric type. The second part then calculates the mean production time as a summary statistic.
library(lubridate)
library(dplyr)
##
## Attaching package: 'dplyr'
## The following objects are masked from 'package:stats':
##
##     filter, lag
## The following objects are masked from 'package:base':
##
##     intersect, setdiff, setequal, union

movies_data = movies_data |>
  mutate(start_date = as_date(start_date),
         end_date = as_date(end_date),
         duration = as.numeric(end_date - start_date))

average_duration = movies_data |>
  group_by(Country) |>
  summarise(average_duration = mean(duration, na.rm = TRUE))
In Excel
In Excel, you would need to use formulas and functions such as
DATEDIF() and AVERAGEIF() to achieve similar results. Let’s take a
moment to refresh our memory on how the movie data is structured within
an Excel sheet.
The following are the steps to accomplish the above task in Excel:
- In cell H2, enter the formula to calculate the duration:
=G-F
Press Enter to calculate the duration for the first row.
Drag the formula down from cell H2 to fill the formula for the remaining rows.
In cell I1, enter the formula to calculate the average duration per country. Where country refers to the range of country values, and duration refers to the range of duration values.
=AVERAGEIF(country, A2, duration)
Press Enter to calculate the average duration for the first country.
Drag the formula down from cell I1 to fill the formula for the remaining countries.
In this Excel approach, we used formulas and functions such as
subtraction and AVERAGEIF() to perform the calculations. While it is
possible to achieve the desired results in Excel, the process involves
multiple steps and formulas, and it may become more complex as the
dataset grows. R however, simplifies the process with its built-in date
functions resulting in cleaner and more efficient code.
Advantages of using R:
Flexibility: R allows us to work with date objects and apply operations on them such as subtraction in order to calculate duration.
Vectorised operations: R allows us to apply calculations to the entire column at once.
Data Manipulation: The {dplyr} data manipulation package in R makes it easier to perform complex tasks on the entire dataset, such as aggregating the data based on country and then determining the average duration.
By utilising R’s ecosystem of packages such as the {lubridate} package for handling dates in R, we can handle complex date calculations efficiently and easily.
Using {dplyr} and {lubridate}
Let’s say we wanted to find the average number of employees on set for movies that were released in the year with the highest average profit.
library("lubridate")
library("dplyr")

# Extract the year from the Start_date column
movies = movies_data |>
  mutate(start_year = year(start_date))

# Calculate the average highest profit per movie for each year
profit = movies |>
  group_by(start_year) |>
  summarise(avg_profit = mean(Highest_profit))

# Determine the year with the highest average profit
profit_year = profit |>
  filter(avg_profit == max(avg_profit)) |>
  pull(start_year)
profit_year
## [1] 2014
Now let’s try to visualise how we would approach this task in Excel. To
replicate the task above, we would need multiple functions such as
MAX(), AVERAGEIFS() as well as date manipulation functions in order
to extract the relevant data before calculating averages. Excel’s
formula-based design and approach might require multiples steps and
complex formulas, which makes the process time consuming and prone to
errors. Handling dates in Excel is a challenge on its own, so while it
is possible to perform these calculations in Excel, it may not be as
efficient and straightforward as in R.
Both R and Excel have their strengths in data manipulation and analysis. Excel is commonly used due to its user-friendly, easily accessible system, making it suitable for quick, basic tasks. However, when it comes to complex data analysis and advanced programming capabilities, R proves to be the superior choice. R, with its packages such as {lubridate} and {dplyr}, provides intuitive syntax specifically designed for handling dates. Its flexibility allows for seamless integration with other statistical and visualisation packages.The ability to write reproducible scripts in R enhances collaboration, documentation, and automation.
In addition to the advantages of using {lubridate}, there are also
several base R datetime functions that provide flexibility in handling
dates. Functions such as as.Date() and difftime() allow for date
manipulations. Base R provides a solid foundation for date operations,
and when combined with additional packages like {lubridate}, it offers a
powerful suite of tools for working with dates.
While Excel remains useful for basic tasks, R’s approach makes it the preferred tool for complex data manipulation and analysis. Its flexibility, extensive community support, and comprehensive packages make R the go-to choice for handling date operations, as well as other advanced data analysis tasks.
If you’re interested in learning more about using R for data analysis, take a look at our training course offerings; there’s something for all levels.