Fullscreen Ahead for Shiny Applications
Browsers have been implementing variations on a JavaScript fullscreen API for over a decade. Unfortunately, for much of that time the APIs varied across browsers. This made actually using it in production somewhat cumbersome.
Finally, with the release of Safari 16.4 in March of this year, the latest versions of all major desktop browsers now support a single, standardized interface. Legacy versions of Safari for desktop are still in use and there’s still no support at all for the Fullscreen API on iPhones; so while you can cover most users with the standardized API, it should still be for progressive enhancement and not as a fundamental requirement for operation of an application.
In this post I’m going to show how we can enhance a toy Shiny application with fullscreen behaviour using only a few lines of JavaScript. Unfortunately, I did have issues using the fullscreen API with the browser that comes with RStudio — while at least some of the methods exist, calling them led to errors being thrown. Because of this, we will launch that app we build straight into the system’s default browser.
You can find all the code on our Github blog repository under “fullscreen-shiny”.
The Shiny App
For the toy Shiny application we’ll use the txhousing dataset from {ggplot2}. The full R code is provided below, but the ui function is the most relevant bit:
library imports
# ./app.R
library("shiny")
library("tidyverse")
library("glue")
# Launch in system's default browser
options(shiny.launch.browser = .rs.invokeShinyWindowExternal)
ui function
ui = fluidPage(
  tags$head(
    tags$link(rel = "stylesheet", href = "style.css"),
    tags$script(src = "fullscreen.js")
  ),
  titlePanel(title = "Texas housing dashboard"),
  sidebarPanel(selectInput(
    "city", "City", unique(txhousing$city), selectize = FALSE
  )),
  mainPanel(
    tags$div(
      plotOutput("salesPlot", height = "100%"),
      "class" = "plot-container",
      "tabindex" = "0"
    ),
    tags$div(
      plotOutput("volumePlot", height = "100%"),
      "class" = "plot-container",
      "tabindex" = "0"
    ),
    tags$div(
      plotOutput("medianPlot", height = "100%"),
      "class" = "plot-container",
      "tabindex" = "0"
    ),
    tags$div(
      plotOutput("listingsPlot", height = "100%"),
      "class" = "plot-container",
      "tabindex" = "0"
    )
  )
)
server function
server = function(input, output, session) {
  baseData = txhousing %>%
    mutate(
      volume = volume / 1000000,
      median = median / 1000,
      date = as.Date(glue("{year}-{month}-01"), "%Y-%m-%d")
    )

  data = reactive({
    baseData %>%
      filter(city == input$city)
  })

  dates = as.Date(c("2000-01-01", "2015-07-01"), "%Y-%m-%d")

  formatLabels = function(label) {
    str_pad(label, 6, pad = " ")
  }

  createPlot = function(data, yProp, yTitle) {
    ggplot(data) +
      geom_line(aes(x = date, y = .data[[yProp]])) +
      labs(x = "Date",
           y = yTitle) +
      scale_x_date(limits = dates,
                   expand = expansion(mult = c(0.025, 0))) +
      scale_y_continuous(
        labels = formatLabels,
        limits = c(0, NA),
        expand = expansion(mult = c(0, 0.025))
      ) +
      theme(
        text = element_text(size = 14, colour = "black"),
        axis.text = element_text(family = "mono", size = 12),
        panel.grid.minor.x = element_blank(),
        panel.grid.minor.y = element_blank()
      )
  }

  output$salesPlot = renderPlot({
    createPlot(data(), "sales", "Number of sales\n")
  })

  output$volumePlot = renderPlot({
    createPlot(data(), "volume", "Total value of sales\n(millions)")
  })

  output$medianPlot = renderPlot({
    createPlot(data(), "median", "Total value of sales\n(millions)")
  })

  output$listingsPlot = renderPlot({
    createPlot(data(), "listings", "Total active listings\n")
  })
}
shinyApp call
shinyApp(ui = ui, server = server)
The accompanying CSS file is very short:
www/style.css
h2 {
    margin-top: 5px;
}

.plot-container {
    height: 190px;
    cursor: pointer;
    padding-top: 5px;
    margin-bottom: 15px;
}

.plot-container:fullscreen {
    cursor: default;
}

.plot-container:last-child {
    margin-bottom: 5px;
}
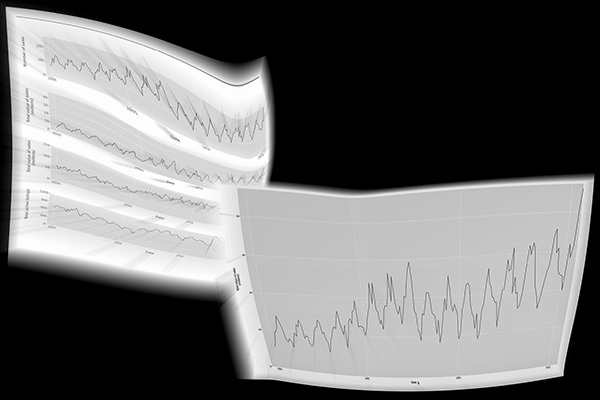
Opening this app in a desktop browser and you should see something like this:

One thing of note from the ui function: I set the heights of the plots to be 100% of their containers:
tags$div(
    plotOutput("salesPlot", height = "100%"),
    "class" = "plot-container",
    "tabindex" = "0"
),
The heights of the containers themselves were then set in the CSS file:
.plot-container {
    height: 190px;
    cursor: pointer;
    padding-top: 5px;
    margin-bottom: 15px;
}
From the above R-code snippet you will also see that I gave the containers a tabindex value of “0”. I’ll explain why later.
The Basic JavaScript
While it’s perfectly possible to use the fullscreen API with only vanilla JavaScript, Shiny already adds jQuery to the page (aliased as $) so we’ll use it for convenience and brevity. We’ll begin by using the ready method to ensure the code inside the supplied function isn’t run until the page has loaded and our plot containers are a part of it:
$(function() {
    'use strict';

    // Interesting code goes here
});
The first thing we can do is check if the fullscreen API is actually supported. If it’s not we can give up straight away.
if (!document.fullscreenEnabled)) {
    return;
}
Now we’ll add a helper function to check whether fullscreen mode is already in action:
function isFullscreen() {
    return !!document.fullscreenElement;
}
This function is very simple and isn’t necessary, but (I think) it does make the later code we’ll see a little easier to read.
Now let’s use jQuery again to grab our plot containers:
const $plotContainers = $('.plot-container');
and add a very simple event handler to them for when they are double-clicked on:
$plotContainers.on('dblclick', function() {
    if (isFullscreen()) { return; }
    this.requestFullscreen();
});
The first line of the body checks we’re not already in fullscreen. The second line uses the special this variable. Inside jQuery event handlers, this refers to the specific document element on which the event listener was triggered so all we need to do with it is requestFullscreen. And that’s it! Double-click on/near a plot and it will go fullscreen and look something like this:

You’ll see — if you try this for yourself — that not only does the container resize, the plot does shortly after. I didn’t have to write any JavaScript to make the latter trick happen. The only thing I had to do was, as mentioned earlier, set the plots to be 100% the height of their container (the width already is by default) in the R code:
plotOutput("salesPlot", height = "100%"),
When the browser put the plot container into fullscreen it forces that element to be 100% wide and tall (superseding the “190px” value I set in the CSS). After that happens, the Shiny JavaScript code magically (I’m 90% sure it’s not actually magic) notices the image is too small and requests a new, bigger, one from the server.
There’s one other tiny little tweak that’s worth mentioning. The CSS sets the cursor style to pointer for the plot containers (hoping to remind an informed user the plot can be blown up if double clicked). The following rule makes use of the :fullscreen pseudoclass to unset it again when (double)-clicking no longer has an effect:
.plot-container:fullscreen {
    cursor: default;
}
You could, of course, use double-click to exit fullscreen, too. But the browser will provide the user with means to exit (press Esc, click a button) and using double-click to make something smaller doesn’t feel intuitive to me .
Adding keyboard functionality
You’ll recall I mentioned adding a tabindex value of “0” to each of the plot containers. This means they can be focused by a keyboard user who uses the “Tab” key to move around the page.

With a little extra JavaScript we can make the fullscreen behaviour keyboard accessible:
$(document).on('keydown', function(event) {
  const code = event.originalEvent.code;
  if(code !== 'Enter' || !isFullscreen()) { return; }
  const focus = document.activeElement;
  if ($plotContainers.toArray().includes(focus)) {
    focus.requestFullscreen();
  }
});
The first line inside the event handler checks which key has been pressed. If that key is “Enter” and we’re not already in fullscreen we check which element currently has focus. If that element is one of our plot containers we make it fullscreen.
The whole JavaScript script
For convenience and clarity, here’s the full fullscreen.js script, with comments added:
www/fullscreen.js
$(function () {
  'use strict';

  // If fullscreen is not supported jump right out
  if (!document.fullscreenEnabled)) {
    return;
  }

  // Simple helper to return a Boolean indicating whether
  // already in fullscreen mode
  function isFullscreen() {
    return !!document.fullscreenElement;
  }


  // Get all the plot containers
  const $plotContainers = $('.plot-container');


  // Make plots go fullscreen when double-clicked
  $plotContainers.on('dblclick', function () {
    if (isFullscreen()) { return; }
    this.requestFullscreen();
  });


  // Add keyboard controls
  $(document).on('keydown', function (event) {
    // Get name of key pressed
    const code = event.originalEvent.code;
    // If the user presses something other than Enter or
    // we're already in fullscreen we can jump staight out...
    if (code !== 'Enter' || isFullscreen()) { return; }
    // Find the element that currently has focus
    const focus = document.activeElement;
    // If that element is one of our plots...
    if ($plotContainers.toArray().includes(focus)) {
      // ...make it fullscreen
      focus.requestFullscreen();
    }
  });
});
Quick notes on accessibility
While we’ve added both mouse and keyboard controls for entering fullscreen, you only know how they work — and that they exist at all — because I’ve outlined them in this article! That is, to keep things simple I’ve omitted instructions in the actual app. In the real world, how fullscreen can be entered should be made clear to all users of the app, not just those who’ve read an accompanying blog post.
For similar reasons, I’ve omitted alt text from the charts, which is also bad for accessibility. You should see our earlier blog post on “Alt Text in R: Plots, Reports, and Shiny” for advice on how to do alt text well.
Finally, the items being made fullscreen here are graphics. But any element can be made fullscreen in browsers that support the API. That includes elements containing descendant focusable elements. In that case be sure to check the behaviour of these elements isn’t adversly affected by the change and ensure they are still accessible to both mouse and keyboard users.