Selecting the correct image file type
This is part two of our four part series
- Part 1: Specifying the correct figure dimension in {knitr}.
- Part 2: What image format should you use for graphics (this post).
- Part 3: Including external graphics in your document.
- Part 4: Setting default {knitr} options.
There are (at least) three file formats to choose from: JPEG, PNG and SVG.
| Attribute | JPEG | PNG | SVG |
|---|---|---|---|
| Type | Raster | Raster | Vector |
| Transparency | No | Yes | Yes |
| Animation | No | No | Yes |
| Lossy | Yes | No | Yes |
| Recommended | Occasionally | Yes | Often |
If you are reading this via a syndication site, be sure to go the original post for updated links.
JPEG Images
As the JPEG compression algorithm significantly reduces file size, JPEG files are ubiquitous across the web.
If you take a photo on your camera, it’s almost certainly using a JPEG storage format.
Historically the file extension was .jpg as Microsoft Windows only handled
three character file extensions (also .htm vs .html).
But today both extensions are used (personally I prefer .jpeg, but I’m not very consistent if I’m
totally honest).
If you did a little Googling on which file format to use for images, then the answer you would come across is that JPEG’s are the default choice. But remember, figures are different from standard images! R figures have text, straight lines, lots of white space, and perhaps transparency.
However,
- JPEGs don’t support transparency.
- The algorithm used to compress a JPEG image is discrete cosine transform (DCT). Essentially, similar pixels within an image are merged. However, this averaging process means that the method is lossy, i.e. by storing the image as a JPEG, we are losing information.
So in general don’t use JPEGs. The only exception might be when you have a “photograph-type” plot, such as a detailed contour or heatmap. You would only consider this, however, if the file size of the PNG was large.
Portable Network Graphics (PNGs)
A Portable Network Graphics file (PNG) is a raster file format that uses lossless compression. It was originally created as a replacement for the GIF, but unlike GIFs, PNG files don’t support animations.
While the PNGs file size is a little larger than JPEGs, it is usually the better default option. For a nicer, smoother image, you should use type = "cairo-png" when creating a png.
The size of a PNG can often be reduced using the optipng
utility. For graphs, a reduction of around 50% isn’t unusual.
Running optipng takes around one to two seconds per image, so isn’t really suitable
for dynamic, i.e. Shiny based applications. However, for generating images that will never change, e.g. blog posts, then an extra second or two is not an issue.
If you’ve already created a bunch of images, then a simple R script can easily optimise all files
png_files = list.files(pattern = "*\\.png$",
                       full.names = TRUE,
                       recursive = TRUE)
for (png in png_files) system2("optipng", png)
The optipng function has a compression argument, that allows you to improve the PNG
compression, e.g.
system2("optipng", args = c("-o1", png))
The argument -o selects the level of compression. The higher the number, the hard optipng tries
to compress. To be honest, I’ve found leaving the compression level at the default level to be
more than significant. Life is too short to worry about the odd byte.
Scalable Vector Graphics (SVGs)
A Scalable Vector Graphics file (SVG) uses an XML-based format to precisely describe how the image should appear. Since the graph is described using text, an SVG can be scaled to different sizes without losing quality, i.e. we no longer worry about resolution.
This format is particularly appealing for figures, which are simply a combination of lines, texts and shapes. The downside is that file sizes can get prohibitively large. For example, if you have a scatter plot with lots of points, each individual point will have it’s own entry in the SVG file.
To understand the trades a bit more, lets create multiple {ggplot2} scatter plots where were gradually increase the number points
library("ggplot2")
no_of_pts = c(1, 5, 10, 50, 100, 500, 1000, 5000, 10000, 50000, 100000)
for (i in no_of_pts) {
  x = runif(i)
  y = runif(i)
  g = ggplot(data = data.frame(x = x, y = y)) +
    geom_point(aes(x, y))
  # Save graphic using SVG, PNG, etc
}
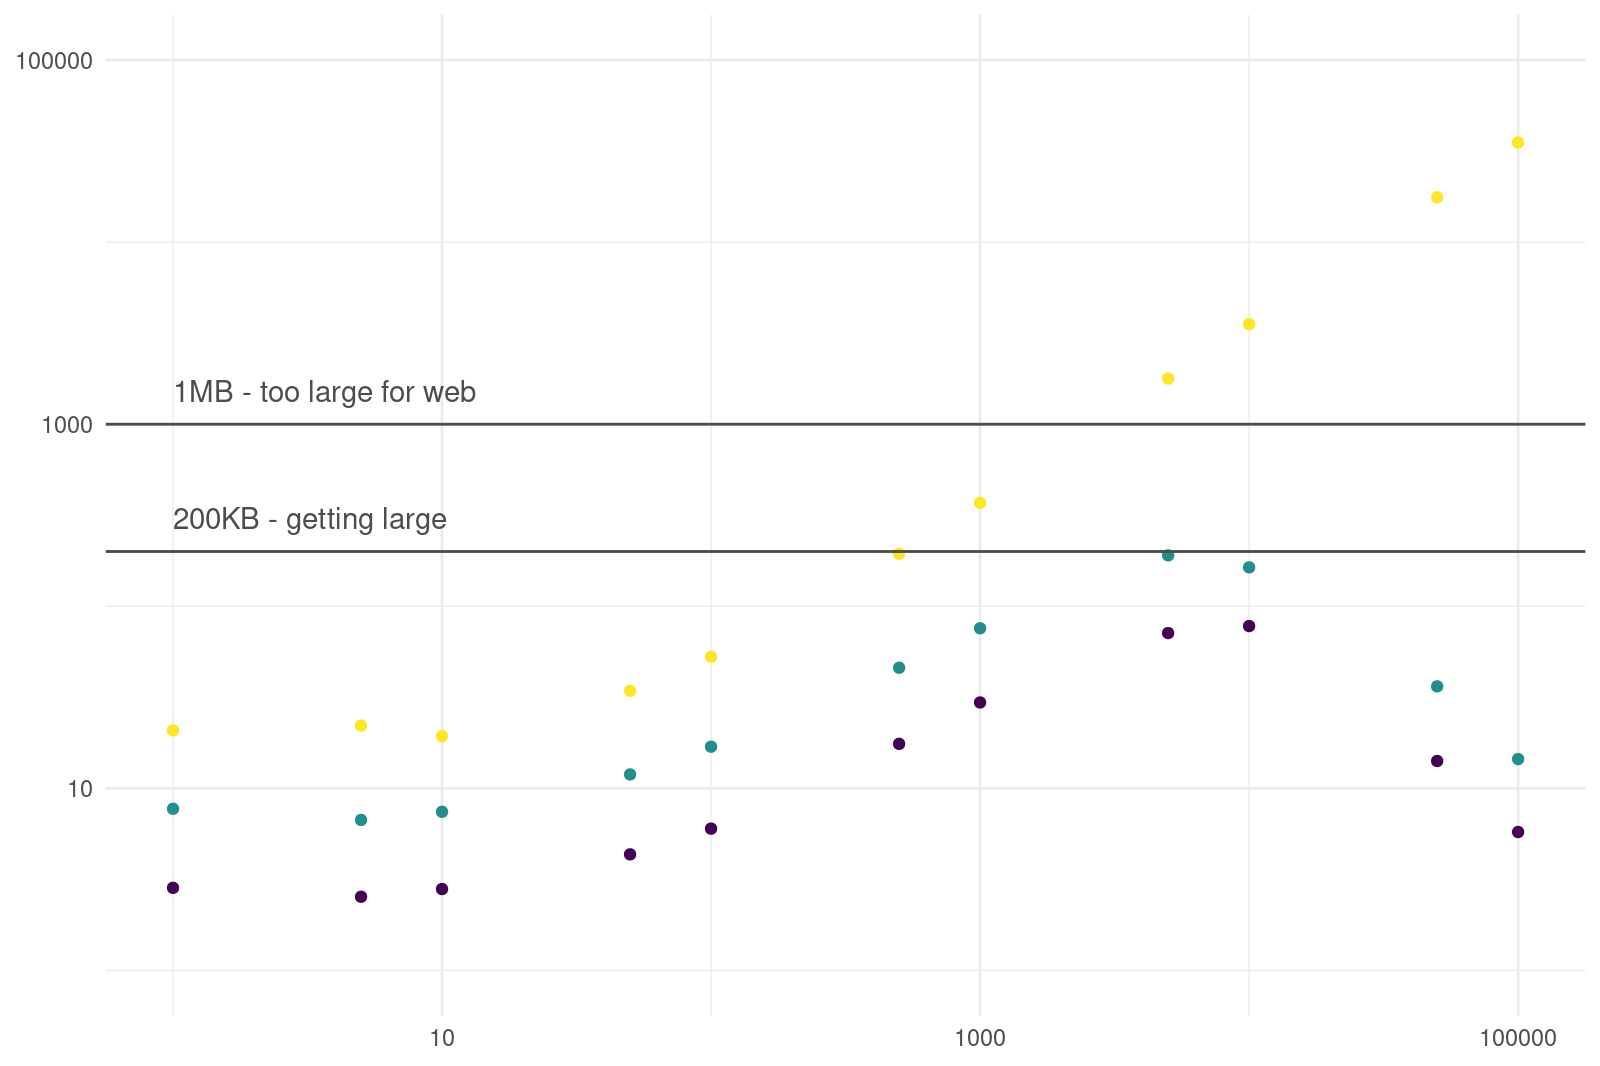
The first scatter plot (when i = 1) only contains a single point, whereas the final scatter plot contains i = 100000 points, and is almost entirely black with points.
For each scatter plot, we generated
- a PNG version
- a PNG version, optimised using
optipng - a SVG graph.

The figure shows that the file size increases with the number of points. However, at around 10,000 pts, the PNGs file size starts to decrease. This is because the plots are simply a black background. However, the file sizes for SVGs increase in a predictably linear fashion. When plotting 200 pts, the file size is starting to get prohibitive. At around 5,000 pts, the SVG file is over 1MB.
As an aside, the JPEG file size is about the same as the PNG file size in this test.
Next Generation Formats
If you’ve ever used Google’s PageSpeed Insights, one of the recommendations is to serve images in next-gen formats, such as JPEG 2000, JPEG XR, and WebP. However, a little investigation suggests this is overkill for the vast majority of sites. As a significant numbers of browsers don’t yet support these formats, shaving off a few bytes doesn’t seem worth the effort. Obviously if you have a top 100 site like Amazon or are serving lots of images on a page, then it may/will be worth the hassle. For most sites using Hugo, shaving milliseconds off load time isn’t required.
Conclusion
Spending a little time optimising file size brings lots of benefits
- your web-pages load faster
- your documents are smaller
- your gitlab repo clones quicker and takes up less storage
Typically, I don’t care about optimising to the nearest byte, but a combination of choosing the correct dimensions and the correct image type, gives you something close to optimal with little thought.