Python application deployment with RStudio Connect: Streamlit

This is the final part of our three part series
- Part 1: Python API deployment with RStudio Connect: Flask
- Part 2: Python API deployment with RStudio Connect: FastAPI
- Part 3: Python API deployment with RStudio Connect: Streamlit (this post)
RStudio Connect is a platform which is well known for providing the ability to deploy and share R applications such as Shiny apps and Plumber APIs as well as plots, models and R Markdown reports. However, despite the name, it is not just for R developers (hence their recent announcement). RStudio Connect also supports a growing number of Python applications, API services including Flask and FastAPI and interactive web based apps such as Bokeh and Streamlit.
In this post we will look at how to deploy a Streamlit application to RStudio Connect. Streamlit is a framework for creating interactive web apps for data visualisation in Python. It’s API makes it very easy and quick to display data and create interactive widgets from just a regular Python script.
Creating a Streamlit app
First of all we need to create a project folder and install Streamlit in a virtual environment. The Streamlit documentation recommends using the Pipenv environment manager for Linux/macOS.
mkdir streamlit-deploy-demo && cd streamlit-deploy-demo
pipenv shell
pipenv install streamlit

# test your installation
streamlit hello
If you are using Windows then see here for how to install Streamlit with Anaconda.
For this demo there are a few other dependencies which we will need to install with,
pipenv install plotly scikit-learn pydeck==0.7.1
If you are getting started with Streamlit you might like to check out their tutorial for a more in depth guide on how to build an app. However, for the purposes of this blog post we give the code for an example app below. This loads california housing dataset and displays some plots and maps of the data using Plotly, Streamlit and Pydeck.
Create a file called streamlit_housing.py with:
touch streamlit_housing.py
and copy the code below into it.
# streamlit_housing.py
import pandas as pd
import numpy as np
from sklearn.datasets import fetch_california_housing
import streamlit as st
import plotly.express as px
import pydeck as pdk
# Give our app a title
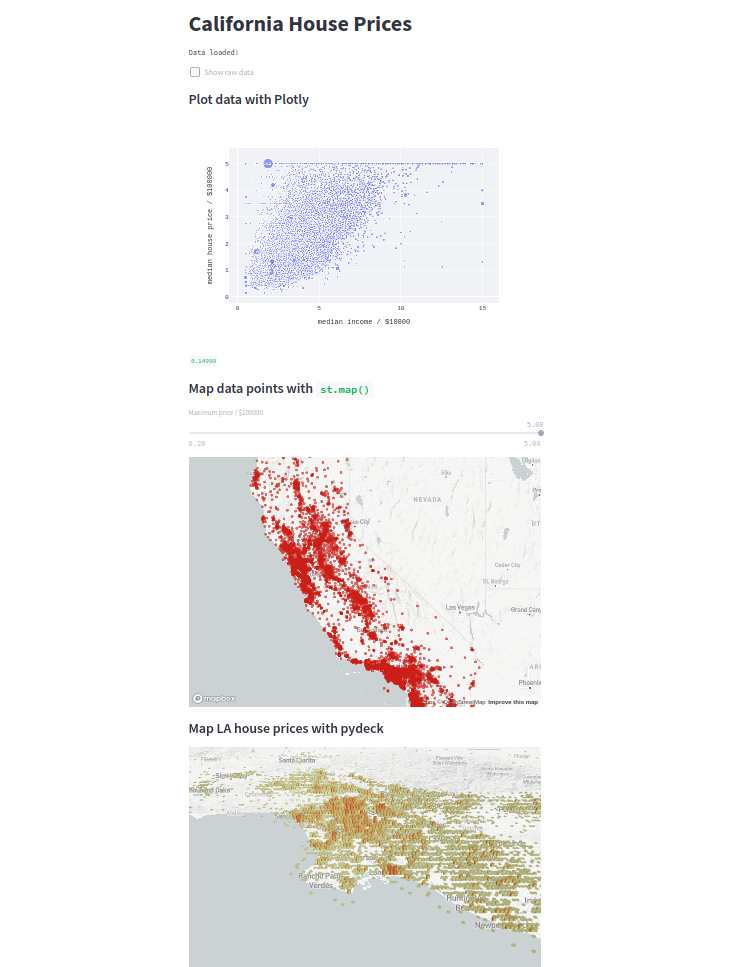
st.title("California House Prices")
# Load our data
@st.cache # cache the data so it isn't reloaded every time
def load_data():
housing = fetch_california_housing()
data = pd.DataFrame(housing.data, columns=housing.feature_names)
data["medprice"] = housing.target
lowercase = lambda x: str(x).lower()
data.rename(lowercase, axis="columns", inplace=True)
return data
data_load_state = st.text("Loading data...")
data = load_data()
data_load_state.text("Data loaded!")
# Add a tickbox to display the raw data
if st.checkbox("Show raw data"):
st.subheader("Raw data")
st.write(data)
# Add a plotly figure
st.subheader("Plot data with Plotly")
fig = px.scatter(data, x="medinc", y="medprice", size="averooms")
fig.update_layout(
font_family="Courier New",
xaxis_title="median income / $10000",
yaxis_title="median house price / $100000",
)
st.plotly_chart(fig)
# Add a map of datapoints
st.subheader("Map data points with `st.map()`")
filter_price = st.slider(
"Maximum price / $100000", 0.2, 5.0, 5.0, 0.1
) # a slider widget to select price
filtered_data = data[data["medprice"] <= filter_price]
st.map(filtered_data)
# Add a pydeck map
st.subheader("Map LA house prices with pydeck")
st.pydeck_chart(
pdk.Deck(
map_style="mapbox://styles/mapbox/light-v9",
initial_view_state=pdk.ViewState(
latitude=33.7783,
longitude=-118.253,
zoom=9,
pitch=50,
),
layers=[
pdk.Layer(
"HexagonLayer",
data=data,
get_position="[longitude, latitude]",
radius=500,
height="medprice",
elevation_scale=4,
elevation_range=[0, 1000],
pickable=True,
extruded=True,
),
],
)
)
To test this app you can run it locally with:
streamlit run streamlit_housing.py
This will automatically open up a window displaying the app.
One of the nice things about Streamlit is it makes it really easy to view our app as we create it. If you navigate to “Settings” from the top right menu and tick “Run on save”, the app will now be updated every time the source script is saved.
Here we have used the Plotly plotting library but the Streamlit API also enables plotting with other libraries such as Bokeh and Matplotlib. The API documentation can be found here.
Deploying to RStudio Connect
In order to deploy our Streamlit app to RStudio Connect, we first of all need to install rsconnect-python with,
pipenv install rsconnect-python
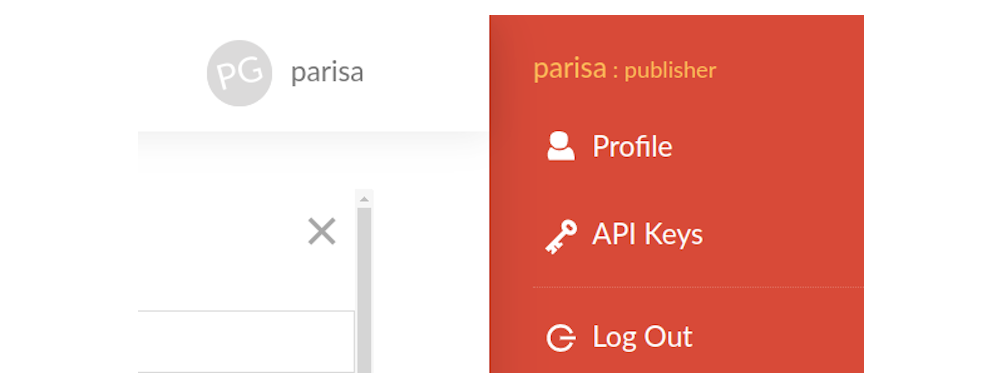
If you have not done so already, you will need to add the server which you wish to deploy to. The first step is to create an API key. Log into RStudio Connect and click on your user icon in the top left corner, navigate to “API Keys” and add a new API key.
Remember to save the API key somewhere as it will only be shown to you once!
It is also useful to set an API key environment variable in a .env file. This can be done by running
echo 'export CONNECT_API_KEY=<your_api_key>' >> .env
source .env
If you wish, you could also add an environment variable for the server you are using,
CONNECT_SERVER=<your server url>
Note the server url will be the part of the url that comes before connect/ and must include a trailing slash.
Now we can add the server with,
rsconnect add --server $CONNECT_SERVER --name <server nickname> --api-key $CONNECT_API_KEY
You can check the server has been added and view its details with
rsconnect list
Before we deploy our app, there is one more thing to watch out for. Unless you have a requirements.txt file in the same directory as your app, RStudio Connect will freeze your current environment. Therefore, make sure you run the deploy command from the virtual environment which you created your Streamlit app in and wish it to run in on the server.
We are now ready to deploy our streamlit app by running,
rsconnect deploy streamlit -n <server nickname> . --entrypoint streamlit_housing.py
from the streamlit-deploy-demo directory. The --entrypoint flag in the command above tells RStudio Connect where our app is located. For Streamlit the entrypoint is just the name of the file which contains our app.
Congrats, your streamlit app has been deployed! You can check it by following the output link to RStudio Connect.
Further reading
We hope you found this post useful!
If you wish to learn more about Streamlit or deploying applications to RStudio Connect you may be interested in the following links: