Quarto for the Python user

As data scientists we often need to communicate conclusions drawn from data. Additionally, as more data is collected, our reports invariably need updating. This is where automated reporting tools such as Quarto come in! In this blog post we will look at how Quarto allows us to weave together text and Python code to generate reproducible reports.
What is Quarto?
Quarto is a technical publishing system built on Pandoc. By combining code with plain text, it allows you to create reports that can easily be updated when the data changes. For example, imagine you have to report on the profits of a company each month. With Quarto, you can create your report with any key figures and charts, then with just the click of a button update it each month with new data. You can also create content in a variety of formats, from articles and scientific papers to websites and presentations, in HTML, PDF, MS Word and more.
How does it work?
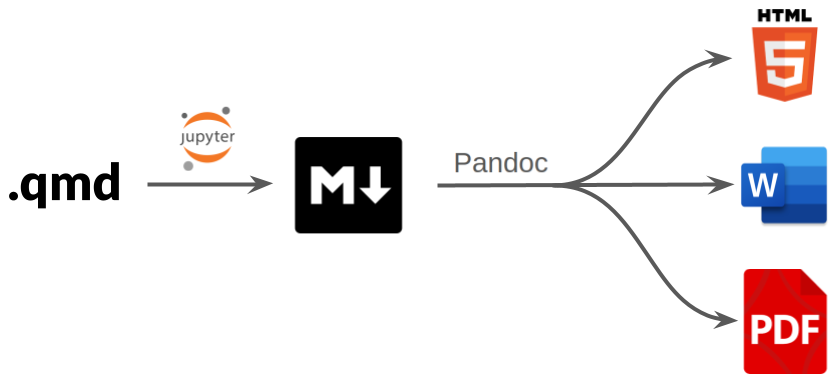
.qmd: For Quarto we work in a
.qmdfile. This will contain a mix of markdown and code chunks.Jupyter: When the file is rendered with Quarto, the code chunks are interpreted by Jupyter. You can also select which Jupyter kernel you want to use.
.md: The code and output, as well as the rest of the content, is then converted to plain markdown.
Pandoc: The markdown file is converted to a variety of other formats using Pandoc.
.html/.pdf/.docx: A
.qmdfile can be rendered in multiple different formats without having to change any content.
Where do I run Quarto?
There are a couple of IDEs where you can run Quarto with Python. For this post we will be focusing on the Quarto extension for VS Code, which offers an extensive variety of tools for editing your documents. As we will show in an upcoming post, you can also render Quarto documents directly from Jupyter notebooks.
First things first you will need to install Quarto. From VS Code, you can then find the extension by clicking on “Settings”, then “Extensions”, then typing “quarto” into the search bar. Select the “Quarto” extension, click “Install” and after a few seconds you’ll be good to go!
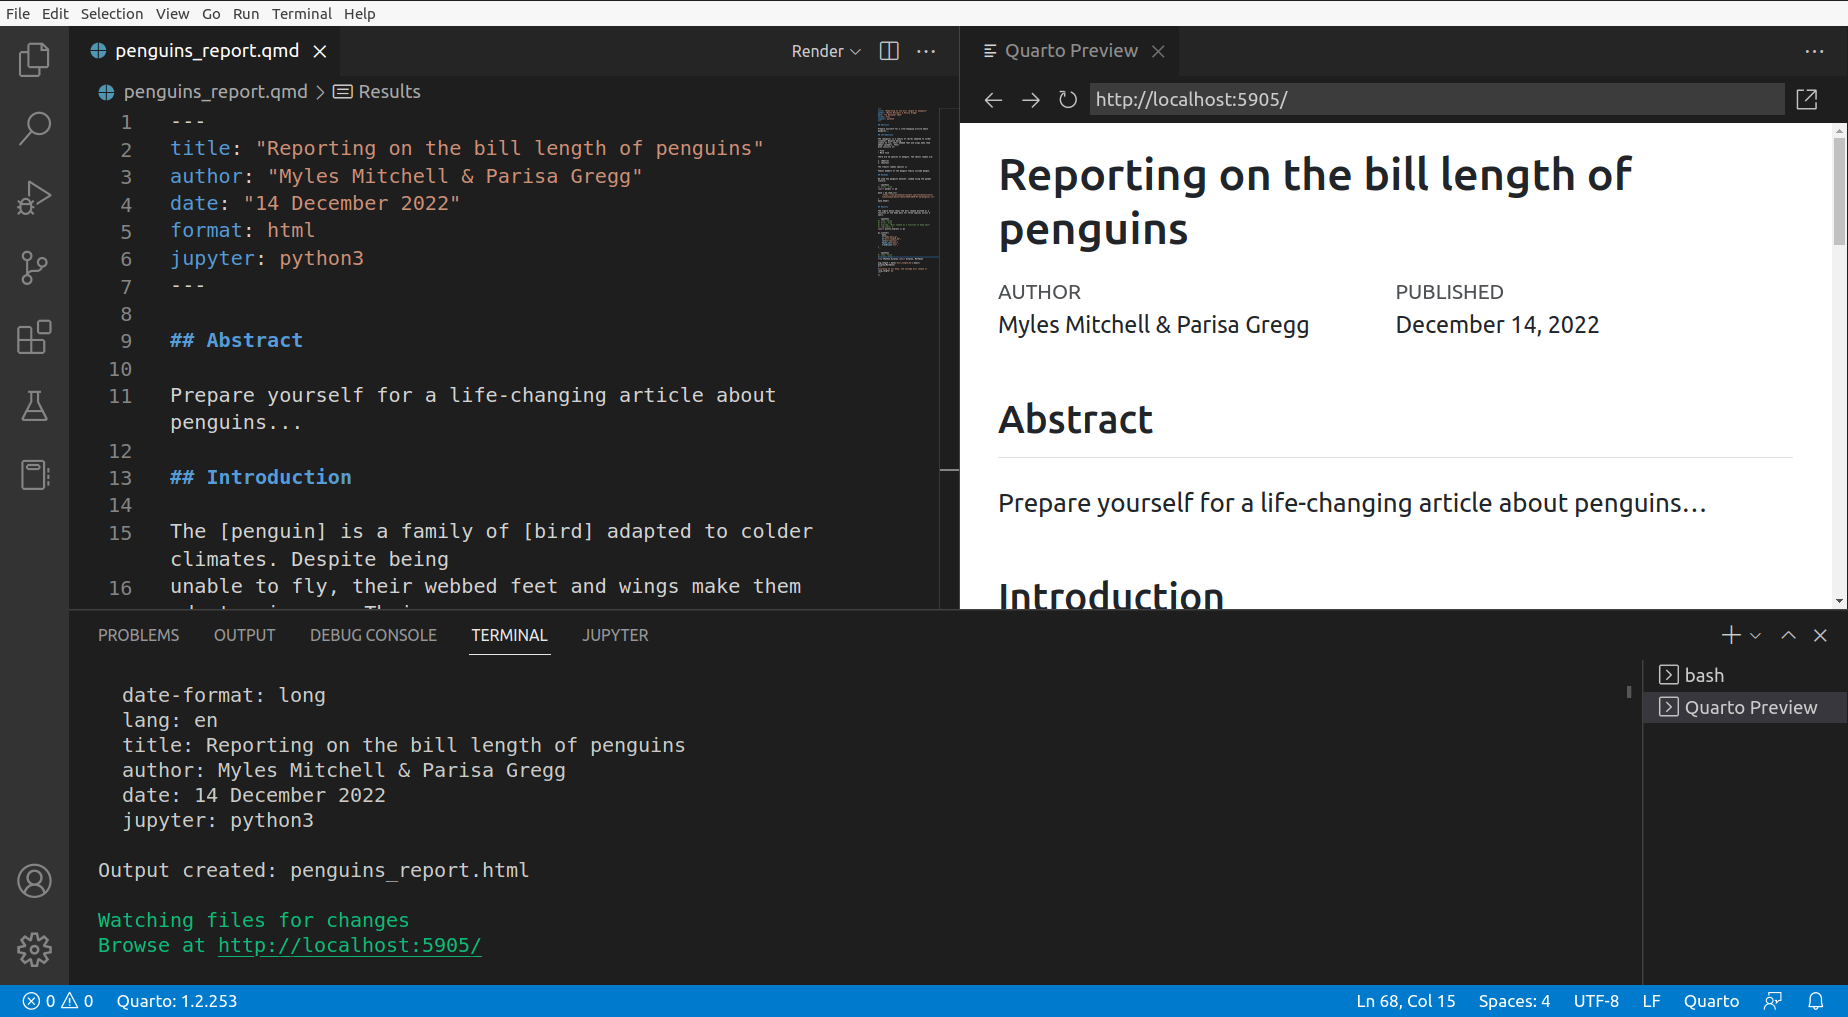
A Quarto document is essentially a text file with a .qmd extension. This can be created in VS Code by clicking on “File”, then “New File…”, then “Quarto Document (qmd)”. Clicking the “Render” button (or using the keyboard shortcut Ctrl+Shift+K) will open a side window with a live preview that will update as you edit the document:
You can also run Quarto via the terminal:
- To preview your document as you edit it:
quarto preview <your-doc>.qmd
- To convert the document from .qmd into the desired output format:
quarto render <your-doc>.qmd
Preparing a document
Let’s use Quarto to write an html web report about penguins! 🐧
If you wish to run the code yourself you will need the following dependencies:
These can be installed with:
python3 -m pip install pandas plotly statsmodels
1) YAML header
To start, we’ll need a YAML header.
YAML is a human readable language often used to write configuration files. In Quarto, it’s used to configure the settings for the presentation and formatting of the documents.
The header is fenced above and below by three hyphens (---). The example below
includes some common settings:
---
title: "Reporting on the bill length of penguins"
author: "Myles Mitchell & Parisa Gregg"
date: "14 December 2022"
format: html
jupyter: python3
---
- The first three should be self-explanatory!
formatsets the preferred output format for your document (html, pdf, docx, …)jupytersets the kernel for executing embedded Python code
You don’t have to specify a Jupyter kernel if the first code chunk is in Python; in that case, Quarto will know to use Jupyter (although you may still wish to select a specific kernel).
2) Markdown text
The main body of text is written in markdown syntax. If you haven’t used markdown before, it’s an easy-to-learn language that allows you to combine plain text and blocks of code.
We’ll say a bit more about Python code chunks below, but for a quick guide to markdown basics, the Quarto documentation is a great place to start!
Here’s an opening passage for our report, written in markdown:
## Abstract

Prepare yourself for a life-changing article about penguins...

## Introduction

[Penguins](https://en.wikipedia.org/wiki/Penguin) are a family
(**Spheniscidae**) of aquatic flightless
[birds](https://en.wikipedia.org/wiki/Bird) that live primarily in the
[Southern Hemisphere](https://en.wikipedia.org/wiki/Southern_Hemisphere).
Their diet consists of:

- Krill
- Fish
- Squid
- More fish

There are 18 species of penguin, including:

1. Macaroni penguin (*Eudyptes chrysolophus*)
2. Chinstrap penguin (*Pygoscelis antarcticus*)
3. Gentoo penguin (*Pygoscelis papua*)
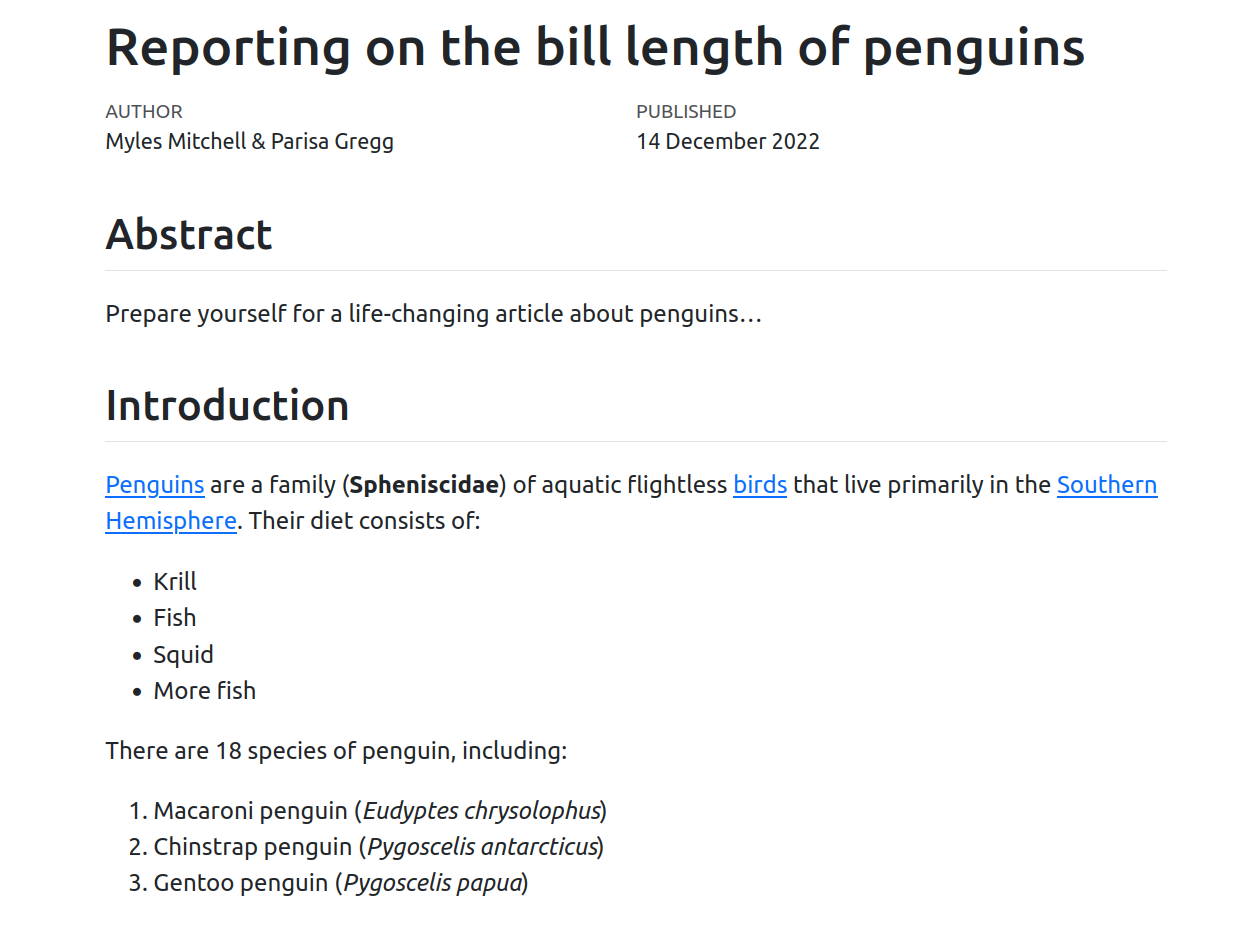
We’ve included hyperlinks, bullet points, numbered lists, bold and italic font using the asterisk symbol, and subheadings using the hash symbol.
The screenshot below shows the rendered output so far:
3) Code chunks
We can use code chunks to insert code into the document. These are fenced off
by three backticks (```). To specify the language we can include {python}
after the first set of backticks.
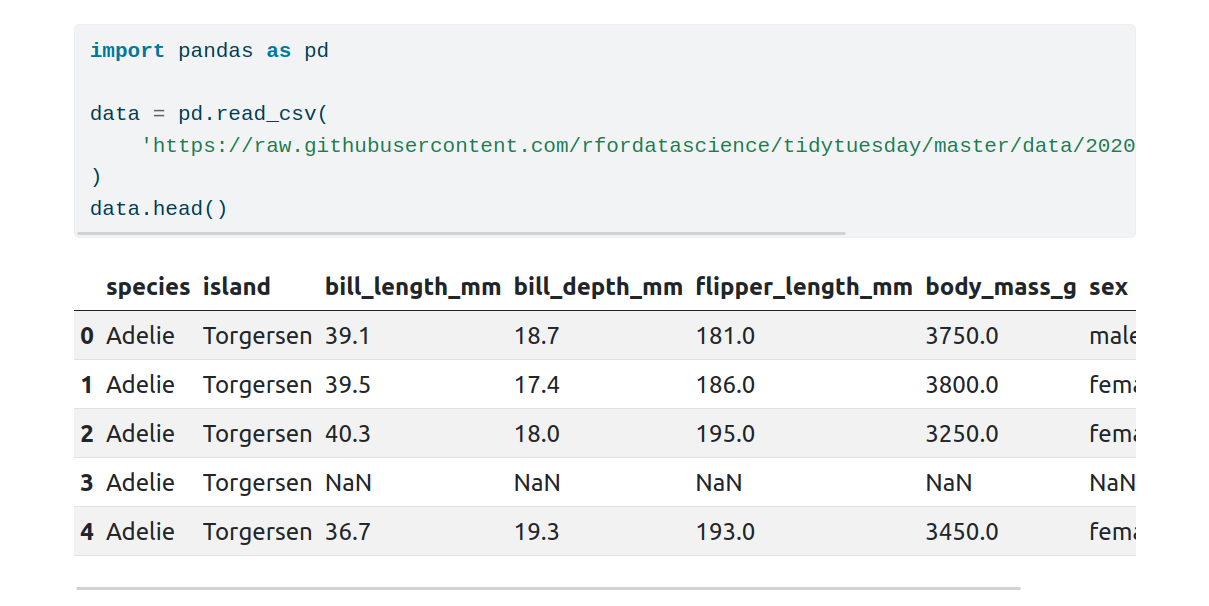
The Python code is not just for show! It can also be used to dynamically generate content including figures and tables. Let’s use some Python code to include a plot in our document. We’ll start by loading in some data using pandas:
```{python}
import pandas as pd

data = pd.read_csv(
    'https://raw.githubusercontent.com/rfordatascience/tidytuesday/master/data/2020/2020-07-28/penguins.csv'
)
data.head()
```
The first five rows of the DataFrame will be displayed by data.head() in
the rendered document, along with the code used to load in the data:
Now let’s make a plot. Because we’re creating a web document, let’s generate an interactive figure using the plotly library:
```{python}
#| echo: false
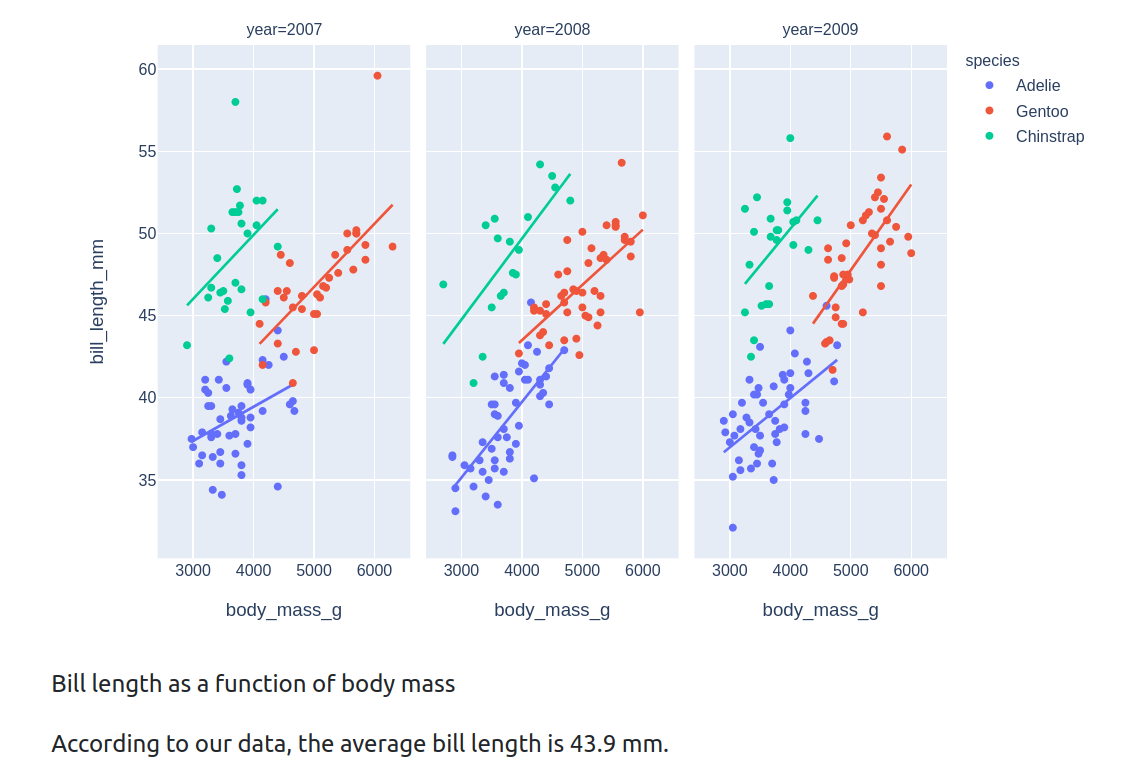
#| fig-cap: "Bill length as a function of body mass"
#| fig-width: 8
import plotly.express as px
px.scatter(
data,
x="body_mass_g",
y="bill_length_mm",
color="species",
facet_col="year",
trendline="ols",
)
```
YAML code chunk options can be provided at the top of a code block, and are
prefixed with #| followed by a space. Here we have used three options:
- Setting
echotofalsewill hide the code chunk in the rendered document - A figure caption will be added by
fig-cap - The figure width is controlled with
fig-width
Some other common options include:
eval: iffalse, the code will not be evaluatedwarning: iffalse, warning messages will be hiddenerror: iftrue, the code is allowed to error and the error message will be displayed in the output
4) Inline-ish code
To insert code inline, just use a pair of backticks:
`data = pd.read_csv(penguins_url)`. Additionally, if you want the code to
have Python formatting you can use `data = pd.read_csv(penguins_url)`{.python}.
You may also wish to execute code inline. Unfortunately, there isn’t a tidy way to add Python-executable code inline as you can with the R language. However, there does exist a workaround where you can create markdown code within a Python codeblock and include values that require Python-execution in the created markdown.
Let’s demonstrate this by adding a sentence stating the average bill length:
```{python}
#| echo: false
from IPython.display import display, Markdown

avg_length = data['bill_length_mm'].mean()
display(Markdown(
f"""
According to our data, the average bill length is
{round(avg_length, 1)} mm.
"""
))
```
We have made use of an f-string to insert a Python variable (rounded to one
decimal place) in the sentence. The Markdown() function is used to convert
the string into markdown, and this is displayed in the rendered document using
display(). If our data changes, we just need to re-render the document and
this text will be updated automatically!
The screenshot below shows this sentence (along with our plot) in the rendered document:
Wrapping up
Let’s put all of this together and apply some finishing touches:
---
title: "Reporting on the bill length of penguins"
author: "Myles Mitchell & Parisa Gregg"
date: "14 December 2022"
format: html
jupyter: python3
---

## Abstract

Prepare yourself for a life-changing article about penguins...

## Introduction

[Penguins](https://en.wikipedia.org/wiki/Penguin) are a family
(**Spheniscidae**) of aquatic flightless
[birds](https://en.wikipedia.org/wiki/Bird) that live primarily in the
[Southern Hemisphere](https://en.wikipedia.org/wiki/Southern_Hemisphere).
Their diet consists of:

- Krill
- Fish
- Squid
- More fish

There are 18 species of penguin, including:

1. Macaroni penguin (*Eudyptes chrysolophus*)
2. Chinstrap penguin (*Pygoscelis antarcticus*)
3. Gentoo penguin (*Pygoscelis papua*)

## Methods

To determine whether a higher body mass implies a longer bill, we loaded a
penguins dataset using pandas:

```{python}
import pandas as pd

data = pd.read_csv(
    'https://raw.githubusercontent.com/rfordatascience/tidytuesday/master/data/2020/2020-07-28/penguins.csv'
)
data.head()
```

## Results

The figure below shows the bill length plotted as a function of the body mass
for three species across a 3-year period.

```{python}
#| echo: false
#| fig-cap: "Bill length as a function of body mass"
#| fig-width: 8
import plotly.express as px

px.scatter(
    data,
    x="body_mass_g",
    y="bill_length_mm",
    color="species",
    facet_col="year",
    trendline="ols",
)
```

```{python}
#| echo: false
from IPython.display import display, Markdown

avg_length = data['bill_length_mm'].mean()
display(Markdown(
f"""
According to our data, the average bill length is
{round(avg_length, 1)} mm.
"""
))
```
Try copying this into your Quarto document or alternatively you can download the full code here. Upon rendering, an html document like the one at this webpage should be created.
Hopefully you can now appreciate the beauty of Quarto! By having the code used to generate the content embedded in the document, our report is fully automated; if the data changes, we just need to click render to update the content. This also makes it easy for a colleague to reproduce the report themselves. And because Quarto uses plain text files, it’s also great for version control with Git!
Further reading
We’ve only covered web reports in this post, but with Quarto you can also write presentations, PDF articles, word documents, and more! There is much more detail in the fantastic Quarto documentation.
Look out for our future post on Jupyter notebooks and Quarto!