Generate multiple presentations with Quarto parameters
Parameterised reporting is a powerful technique that allows you to create dynamic and customisable reports by incorporating user-defined parameters. These parameters act as placeholders that can be easily modified to generate tailored reports based on specific inputs or conditions, enabling seamless updates to reports without the need for manual modifications. Quarto, a modern and flexible document generation tool, provides excellent support for parameterised reporting.
In this blog, we will be looking at a Quarto Reveal JS presentation as an example. By defining parameters within a Quarto presentation, you can easily add flexibility and interactivity to your presentations, allowing you to tailor the content to the specific needs or preferences of your audience.
Creating a Reveal JS presentation
You can easily create a Reveal JS presentation in RStudio with
File > New File > Quarto Presentation > Reveal JS. This will create a
Quarto file (let’s call it slides.qmd) as usual. We are going to be
using a slightly modified version of the
TidyTuesday
data set on UFO
sightings.
The CSV file for the data set is available on our
GitHub.
In this data set, we have information on UFO sightings between 2019 and
2022 from different US states.
We will update the YAML for our presentation to add a title as well as update the theme to make it look a little bit nicer.
---
title: "UFO Sightings"
format:
  revealjs:
    theme: simple
---
We’ll also add some general package-loading and data-reading code to the top of our presentation.
library("dplyr")
library("ggplot2")

ufo_sightings = readr::read_csv("ufo_sightings.csv")
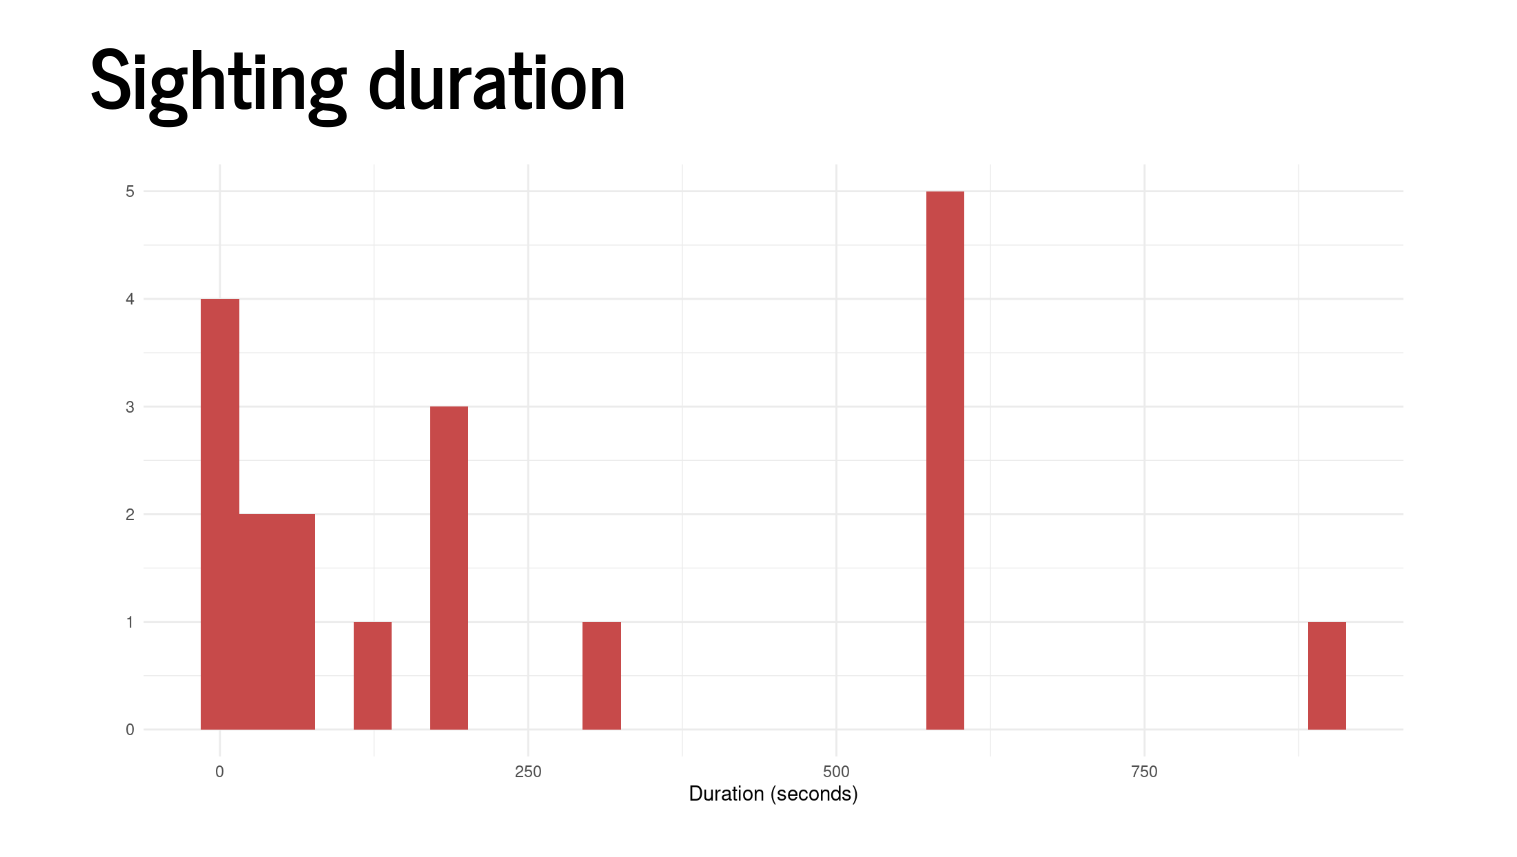
Let’s say we wanted to include a histogram of UFO sighting durations in our presentation. For Idaho in 2022, the code would look something like this:
ufo_subset = ufo_sightings %>%
  dplyr::filter(
    year == 2022,
    state_name == "Idaho"
  )
to create a subset of the full UFO sighting data set and then:
ufo_subset %>%
  ggplot(aes(x = duration_seconds)) +
  geom_histogram(fill = "#c74a4a") +
  labs(x = "Duration (seconds)", y = "") +
  scale_x_continuous(labels = scales::comma_format()) +
  theme_minimal()
to create the histogram itself. We can then add this to a slide of our presentation and add the heading “Sighting duration”.
 Now, what if we wanted to create this plot but for another state-year
combination. This is where we need parameters.
Now, what if we wanted to create this plot but for another state-year
combination. This is where we need parameters.
Using parameters in Quarto
To add parameters to your Quarto document or presentation, you need to
use the params option in the YAML. We want to be able to generate our
report flexibly with different combinations of US state and year, so we
will create a parameter for each of them. We will use Idaho and 2022 as
the default values for these parameters.
---
title: "UFO Sightings"
format:
  revealjs:
    theme: simple
params:
  state: "Idaho"
  year: 2022
---
These parameters are then stored in the params list accessible from
within your presentation. So we can now update our code from before to
instead rely on params$year and params$state instead of the
hard-coded year and state.
ufo_subset = ufo_sightings %>%
  dplyr::filter(
    year == params$year,
    state_name == params$state
  )
Now, our plot will automatically update each time we re-generate the presentation with different parameters.
Before we go through how to actually generate the presentation with
different values than the defaults, let’s first also add a subtitle to
the presentation which will change as the parameters change. So,
something like:
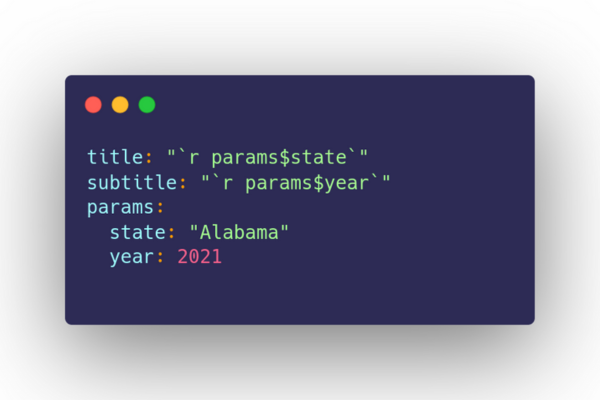
---
title: "UFO Sightings"
subtitle: "`r params$state`, `r params$year`"
format:
  revealjs:
    theme: simple
params:
  state: "Idaho"
  year: 2022
---
Render with parameters
To render our presentation with different parameters, we have a few different options.
If you prefer to render your presentation using an R function, you can
use quarto::quarto_render() to render your presentation. You’ll just
need to provide the input .qmd file, as well as a list of the
parameters with the execute_params argument. So, if you wanted to
generate the presentation for Alabama in 2021 this time, your command
would look something like:
quarto::quarto_render(input = "slides.qmd",
                      execute_params = list("year" = 2021,
                                            "state" = "Alabama"))

If you’d rather render your presentation from the command line, you can
also easily do so with the quarto render command paired with the -P
parameter flag.
quarto render slides.qmd -P year:2021 -P state:"Alabama"
You can also supply a YAML file of key:value pairings when rendering
your presentation with parameters. Simply create a file called
params.yml, and define your parameters. To change the parameters for a
new run, you can just update your YAML file.
Your YAML file would look something like:
# in params.yml
year: 2020
state: 'Alabama'
and then, to render:
quarto render slides.qmd --execute-params params.yml
Rendering multiple parameter combinations at once
Being able to render a presentation with different parameters is useful. But let’s say you needed a single presentation for each combination of state and year. You’d end up needing to manually render 250 separate presentations. So, we want to automate rendering multiple combinations of parameters at once.
Instead of rendering 250 files, let’s take a sample of 3 states and 2 years, so we’ll end up with 6 presentations in total. We then create a tibble of the year-state combinations we want to generate presentations for:
years = unique(ufo_sightings$year)[1:2]
states = unique(ufo_sightings$state_name)[1:3]

params = tidyr::crossing(
  year = years,
  state = states
)
params
You can then either build a for loop or use the
{purrr} package to iterate over the
state-year combinations. If you want to learn more about iteration,
check out our Programming with
R
and our Functional Programming with
purrr
courses.
Here, we’re using the walk2() function from {purrr} to iterate over
the different year-state combinations to create multiple files. The
walk2() function lets you iterate over two inputs simultaneously and
is used when your function has a side effect, such as writing a file,
rather than wanting the output returned as an R object.
We also include our input parameters in the output file name to allow us to distinguish between the multiple output files:
purrr::walk2(params$year, params$state, ~quarto::quarto_render(
  input = "slides.qmd",
  execute_params = list("year" = .x,
                        "state" = .y),
  output_file = glue::glue("{.y}_{.x}.html")
))
Running this command, you end up with 6 aptly named output files:
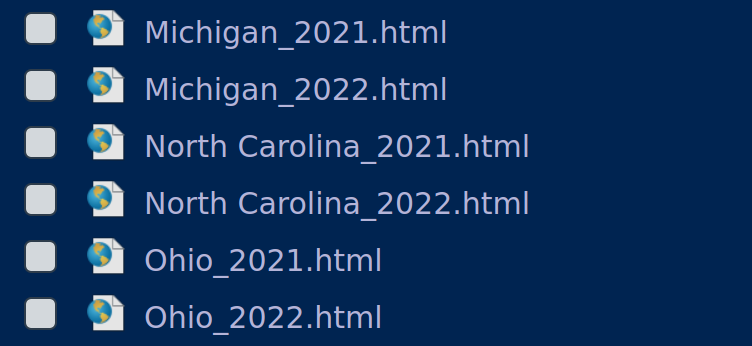
And there you have it! Generating multiple presentations or reports at once is a fairly straightforward process when using Quarto to render your outputs. You can of course extend this logic and create much more in-depth reports or presentations with different kinds of outputs, including text summaries, which depend on input parameters.
To see the full code behind this blog post, as well as some further examples in a more fleshed out Quarto report, check out the blogs repo on our GitHub.