Sparkline Package for Inline Visualisations
Introduction
Sparkline
This was the introductory part of the blog series, the second part will be on embedding sparklines in html tables. The CRAN {sparkline} package allows you to make small inline html charts using jQuery in R.
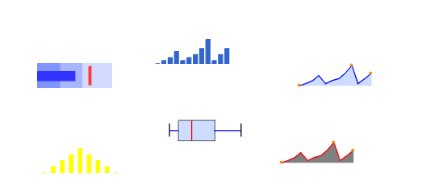
Charts Available With {sparkline}
You can make the following charts with the package:
- Line
- Bar
- Tristate
- Discrete
- Bullet
- Pie
- Box Plot
The omnipotent.net website has a great feature for viewing the different types of chart. I will show a few examples here, along with the code for producing them.
Note the documentation for all of the different charts is great and can be found here.
All of the plots from this package use the sparkline function, and we
pass the type of chart we want as the type argument (default is line).
The function will take a vector or list for the values argument,
depending on the type of chart we are creating this can be either data
to plot or specifications for the plot.
Note: I am using spk_add_deps so I can display them in this blog.
Line
library(sparkline)

data = list(1, 2, 3, 5, 2, 3, 4, 6, 9, 2, 4, 6)

line1 = sparkline(values = data, type = "line") |>
  spk_add_deps()
We can remove the fill and the spots using the following arguments.
line2 = sparkline(values = data, type = "line", spotRadius = "", fillColor = "")
Bar
bar1 = sparkline(values = data, type = "bar")
We can change the bar colors, spacing and width.
bar2 = sparkline(values = data, type = "bar", barColor = "red", barSpacing = "10", barWidth = 8)
Box Plots
For box plots, the data passed to the values argument will be used to
calculate the chart. If you want to pass in pre-computed values like
median, max or min for example, you can do this using the raw = TRUE
and pass them in as the values argument.
box = sparkline(values = data, type = "box")
Bullet Graph
This is one of the examples where the values passed correspond to
specifications for the plot and should be ordered as: target,
performance, range1, range2, range3.
bullet1 = sparkline(values = c(7, 5, 10, 6, 3), type = "bullet")
bullet2 = sparkline(values = c(7, 5, 10, 6, 3), type = "bullet", rangeColors = c("lightgrey", "grey", "slategrey"))
See you in the next blog post about embedding sparklines in html tables.