Theming diffify for accessibility: Part 1
This is part one of our two part series
- Part 1: Theming diffify for accessibility: Part 1 (this post)
- Part 2: Theming diffify for accessibility: Part 2
For most web developers the switch from desktop or laptop to mobile device will be something they do most days. We know what a designed-only-for-desktop experience feels like on a mobile device and it isn’t great. But accessibility on the web isn’t just about checking that your website is largely agnostic to the physical size of your users’ screens, it’s also about making your content available to those users who have physiological impairments. For those of us fortunate enough to have close-to-normal vision (perhaps after correction) and good fine-motor-control it’s easy to forget that others do not.
In this blog post and a follow up I’m going to describe why and how we used theming to make diffify.com more accessible to users who suffer from some common visual impairments. Here in Part 1 I’ll cover some of the science and the terminology. Part 2 will look at the actual changes we made.
Impaired contrast sensitivity
Contrast sensitivity is a measure of our ability to distinguish between foreground and background objects of differing luminance. Correspondingly, people with low/impaired contrast sensitivity may struggle when the difference in luminance between foreground and background objects is small. In our particular case we’re talking about foreground text on a solid-colour background.
Impaired contrast sensitivity is associated with a number of physiological conditions. Some of these seemed obvious to me - cataracts, glaucoma, macular degeneration. Others less so - diabetes, Parkinson’s disease. Moreover, as highlighted by Ashley Firth (in Chapter 3 of his excellent book “Practical Web Inclusion and Accessibility”), low-contrast text can also be a struggle for those experiencing a temporary condition such as a migraine or, simply, tiredness.
The Web Content Accessibility Guidelines (WCAG) set out some complicitly standards for contrast levels (and much much more besides). We wanted to ensure we offered an option that meets their AA standard for text.
Colour vision deficiencies and colour blindness
The terminology around colour vision deficiencies can be confusing.
People with normal colour vision have three types of functioning colour-sensitive cells in their eyes and are said to be “trichromats” (from the Greek “tri” => three and “chroma” => colour). Those cells are called “cones” and have different wavelength peak sensitivities. These are sometimes referred to as “red”, “green” and “blue” cones, but more accurate terms are “long” (“L”), “medium” (“M”) and “short” (“S”) in reference to those wavelengths. The chart below (from the Wikipedia article on cone cells) shows that the peak sensitivity of the L cone cells is actually in the yellow part of the visible spectrum, not the red.

Some people only have two types of functional cones. Correspondingly they are called “dichromats”. People lacking functional L cones are “protanopes” while those lacking functional M cones are “deuteranopes” and those without functional S cones are “tritanopes”.
Alongside true dichromacy there is also “anomalous trichromacy”. Anomalous trichromats have three functional types of cones, but one type does not function as expected. These three conditions are then referred to as “protoanomaly”, “deuteranomaly” and “tritanomaly”.
Collectively, suffererers from these conditions are often said to be “colour blind”. However, all sufferers can see colour so this is something of a misnomer. Nevertheless, “protans” (those who suffer from protanopia or protoanomaly) and “deutans” (deuteranopia or deuteranomaly) are often said to have red-green colour blindness while “tritans” (tritanopia or tritanomaly) may be said to have blue-yellow colour blindness.
Collectively, the groups that are said to exhibit red-green colour blindness are much larger than the groups said to exhibit blue-yellow colour blindness. But it’s important to stress that this does not mean we simply avoid pairing two colours we semantically refer to as “red” and “green” together. It’s more complicated than that: Trichromats see colour in a three-dimensional space, dichromats see colour in a two-dimensional space and the names we give to colours occupy a somewhat fuzzy, somewhat discrete space.
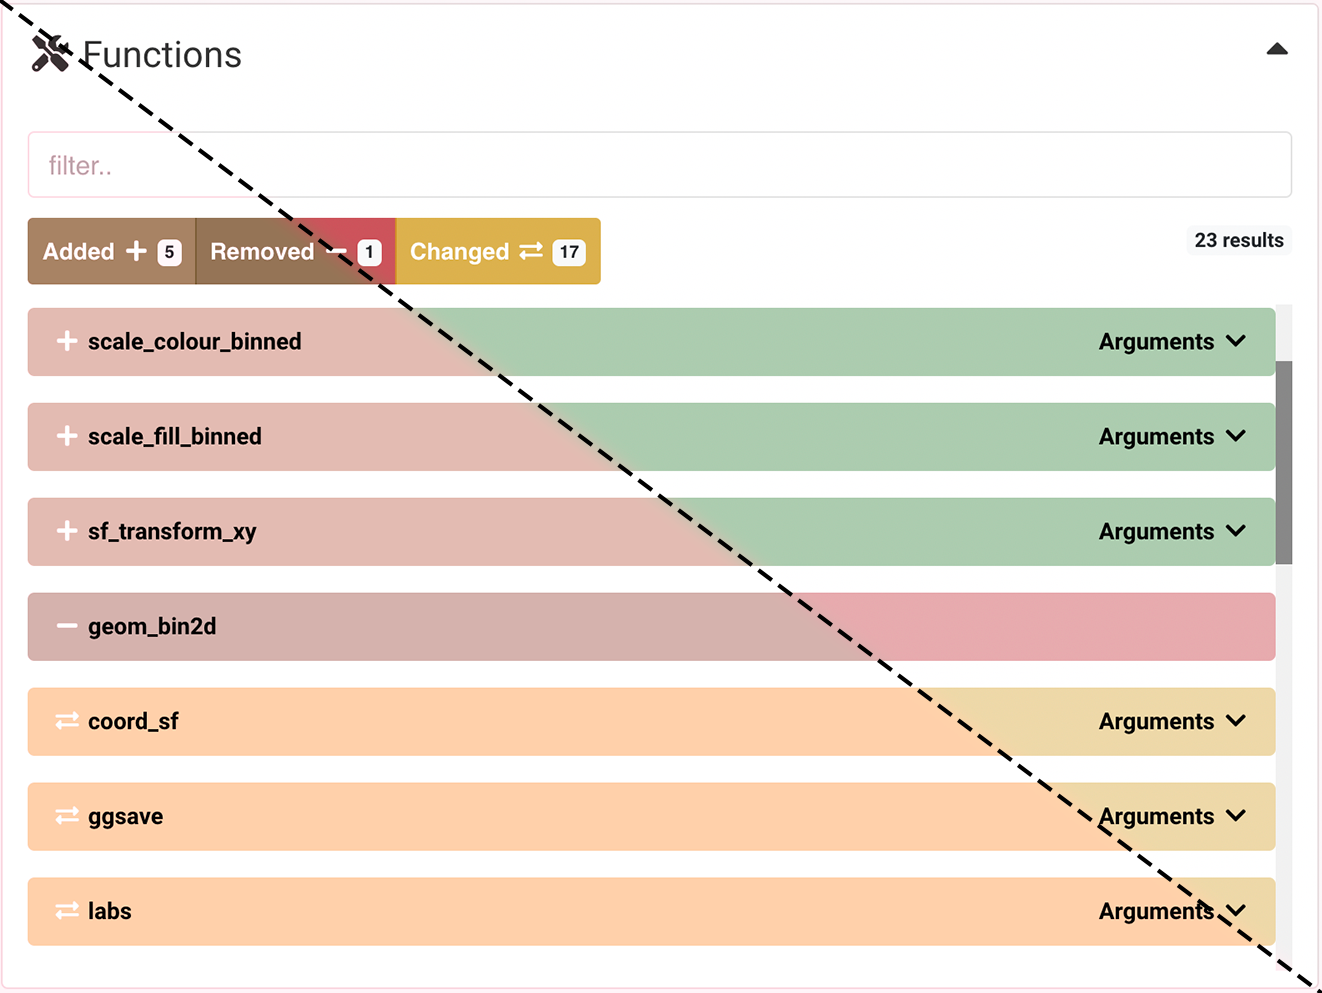
The image below shows a screenshot of the Functions section of diffify for the {ggplot2} package using the default theme that most users will see when they visit the site for the first time. Overlaid on the bottom-left half of the image is a simulation (we used Sim Daltonism, more on that in Part 2) of how the screenshot would appear to a user with deuteranopia.

The simulation suggests that deuteranopes might struggle to see the difference between the colours used for “Added” and “Removed” buttons and entries. There is additional encoding with the plus and minus symbols, but we wanted to offer something better.
Other, more extreme, colour vision deficiencies exist including several forms of “monochromacy”. “Monochromats” can only distinguish colours through their brightness. These conditions (where the term “colour blind” is, perhaps, more appropriate) are very rare and so won’t be covered further here.
Coming Up
In Part 2 I’ll cover what theming is, how we used it to improve diffify and the tools we used to help us test our improvements.
Of course we aren’t claiming we’ve got everything right. If you think there’s anything we missed or just got wrong, please do let us know by raising an issue in the diffify github repository.