Porting a Shiny App to Observable Framework: Part 2
Published: January 30, 2025.
This post, Part 2 in a series of two, looks at styling and deploying the Observable Framework app we built in part 1.
Published: January 30, 2025.
This post, Part 2 in a series of two, looks at styling and deploying the Observable Framework app we built in part 1.
Published: January 16, 2025.
This post, Part 1 in a series of two, looks at porting the functional code of a Shiny app - written in R - into JavaScript code to be used in an Observable Framework application.
Published: August 18, 2022.
Roll up, roll up! Most R packages contain a NEWS file which documents the changes between each release. However, there is no definitive convention for how to format this file. In this post we will share some top tips for writing NEWS files, so that by the end you will be able to tell “good” NEWS from “fake” NEWS!

Published: April 15, 2020.
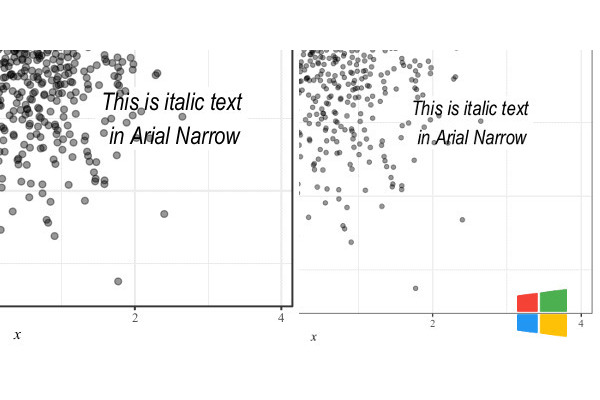
In our recent post about saving R graphics, it became obvious that achieving consistent graphics across platforms or even saving the “correct” graph on a particular OS was challenging. Getting consistent fonts across platforms often failed, and for the default PNG device under Windows, anti-aliasing was also an issue.
Published: April 14, 2020.
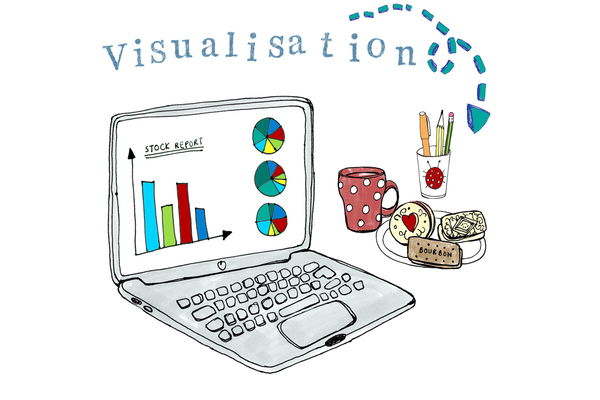
R is known for it’s amazing graphics. Not only {ggplot2}, but also {plotly}, and the other dozens of packages at the graphics task view. There seems to be a graph for every scenario. However once you’ve created your figure, how do you export it? This post compares standard methods for exporting R plots as PNGs/PDFs across different OSs.